Analysis of EUR/NZD for March 28, 2016


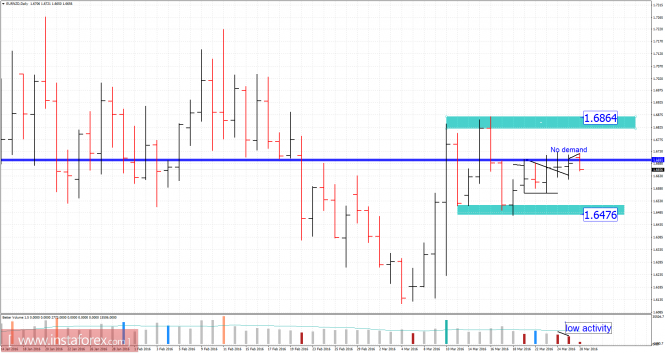
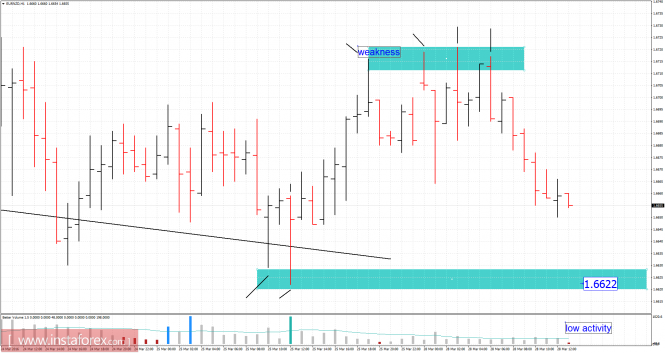
Recently, EUR/NZD has been moving sideways around the 1.6660 mark. On the daily chart, the price is still trading in the defined trading range between the 1.6475 level (support) and the 1.6865 level (resistance). Also, there is no demand bar from Friday, which is a sign that buyers don't have power at this stage for further bullish momentum. According to the 1H time frame,I found signs of weakness around the price of 1.6720, which is a sign that we may see further downward movement on intraday bias. The first intraday downward target is set at at the price of 1.6620. Anyway, according to short-term prospective, wait for a successful breakout of the trading range to confirm further direction.
Fibonacci Pivot Points:
Resistance levels:
R1: 1.6710
R2: 1.6735
R3: 1.6770
Support levels:
S1: 1.6635
S2: 1.6610
S3: 1.6570
Trading recommendation for today: There is downward pressure according to intraday time frames. However, the market is still sideways in the short-term prospective. Watch for a breakout of a trading range to confirm further direction.
The material has been provided by InstaForex Company - www.instaforex.com


