USD/CAD Intraday Technical Levels and Trading Recommendations for March 7, 2016
USD/CAD Intraday Technical Levels and Trading Recommendations for March 7, 2016


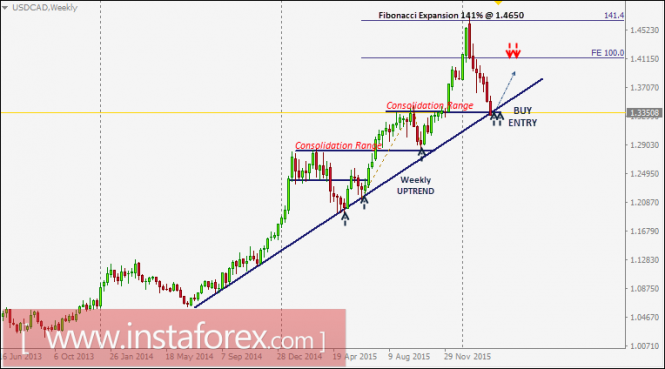
A bullish breakout above the previous consolidation zone between 1.2400 and 1.2800 was performed on July 15 (shown on the weekly chart).
A significant bearish rejection was observed around 1.3450. Hence, another consolidation range was established from 1.3450 down to 1.2800.
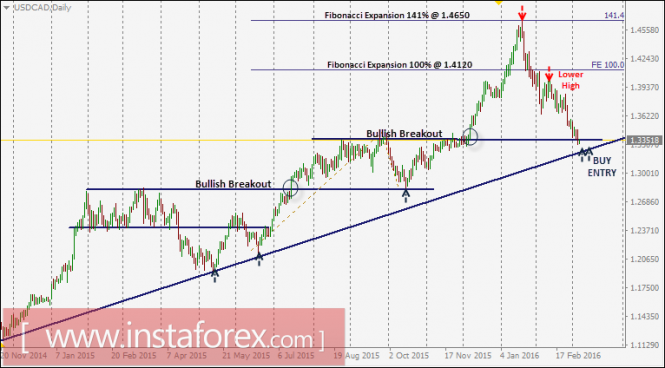
On December 7, a bullish breakout above 1.3450 (the upper limit of the recent consolidation range) enhanced the bullish side of the market. Hence, a bullish visit to the resistance level of 1.4120 (Fibonacci Expansion 100%) was executed.
Bullish persistence above 1.4150 enhanced the bullish side of the market towards 1.4650 (141.4% Fibonacci expansion) where an evident bearish rejection was expected (bearish engulfing weekly candlestick).
Evident bullish recovery was seen around the level of 1.3750. That is why, the recent bullish pullback took place towards 1.4000 few weeks ago.
The level of 1.4120 (Fibonacci Expansion 100%) remains a significant key level to be watched for further price reactions.
On the other hand, the current price zone of 1.3350-1.3370 stands as a significant support zone to be watched for a valid buy entry.
Price zone of 1.3350-1.3370 corresponds to a daily uptrend line and a previous prominent breakout level. Hence, signs of bullish rejection should be expected around it.
Trading recommendations:
Conservative traders should look for a bullish entry around the current price zone of 1.3350-1.3370.
S/L should be located below 1.3300. Initial T/P levels should be located at 1.3630 and 1.3750.
The material has been provided by InstaForex Company - www.instaforex.com


