Forum
Market
Signals
Freelance
VPS
Quotes
MetaTrader
Articles
CodeBase
Algo Forge
Documentation
AlgoBook
NeuroBook
Calendar
WebTerminal
Tools
About
Algo Trading Channel
Home
Type
/
to search: @user, $symbol, ...
Log in
Create an account
English
Русский
中文
Español
Português
日本語
Deutsch
한국어
Français
Italiano
Türkçe
Charts
All Blogs
/
My Trading
/
Charts
Charts
Pre US Open, Daily Technical Analysis Thursday, February 18, 2016
18 February 2016, 13:22
Mohammed Abdulwadud Soubra
0
210
Pre US Open, Daily Technical Analysis Thursday, February 18, 2016
Please note
that due to market volatility, some of the below sight prices may have already been reached and scenarios played out.
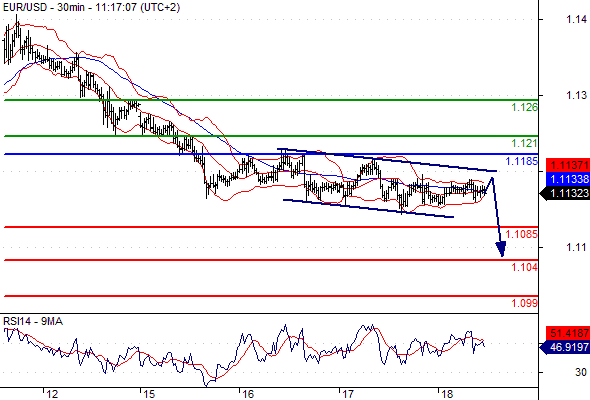
EUR/USD Intraday: the downside prevails.
Pivot:
1.1185
Most Likely Scenario
: short positions below 1.1185 with targets @ 1.1085 & 1.1040 in extension.
Alternative scenario
: above 1.1185 look for further upside with 1.1210 & 1.1260 as targets.
Comment
: The pair is trading within a bearish channel.
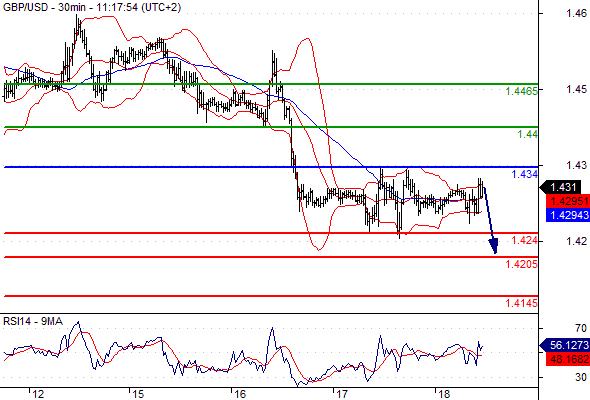
GBP/USD Intraday: under pressure.
Pivot:
1.4340
Most Likely Scenario
: short positions below 1.4340 with targets @ 1.4240 & 1.4205 in extension.
Alternative scenario
: above 1.4340 look for further upside with 1.4400 & 1.4465 as targets.
Comment
: as long as 1.4340 is resistance, look for choppy price action with a bearish bias.
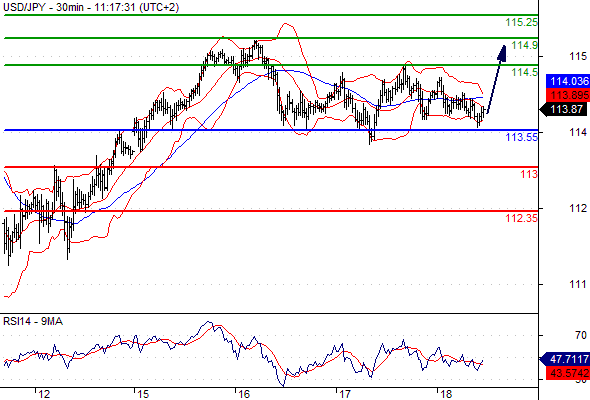
USD/JPY Intraday: bullish bias above 113.55.
Pivot:
113.55
Most Likely Scenario
: long positions above 113.55 with targets @ 114.50 & 114.90 in extension.
Alternative scenario
: below 113.55 look for further downside with 113.00 & 112.35 as targets.
Comment
: a support base at 113.55 has formed and has allowed for a temporary stabilisation.
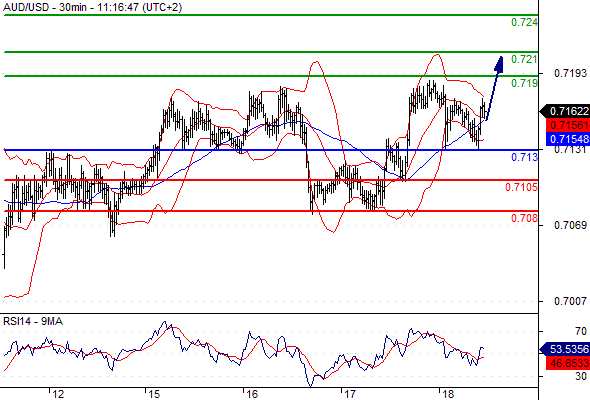
AUD/USD Intraday: the bias remains bullish.
Pivot:
0.7130
Most Likely Scenario
: long positions above 0.7130 with targets @ 0.7190 & 0.7210 in extension.
Alternative scenario
: below 0.7130 look for further downside with 0.7105 & 0.7080 as targets.
Comment
: the RSI is mixed to bullish.
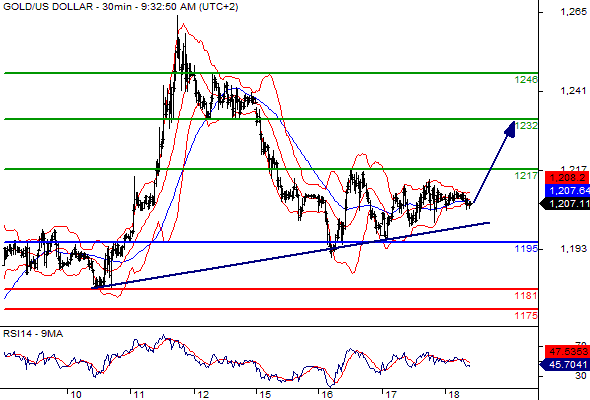
Gold spot Intraday: supported by a rising trend line.
Pivot:
1195.00
Most Likely Scenario
: long positions above 1195.00 with targets @ 1217.00 & 1232.00 in extension.
Alternative scenario
: below 1195.00 look for further downside with 1181.00 & 1175.00 as targets.
Comment
: the RSI lacks downward momentum.
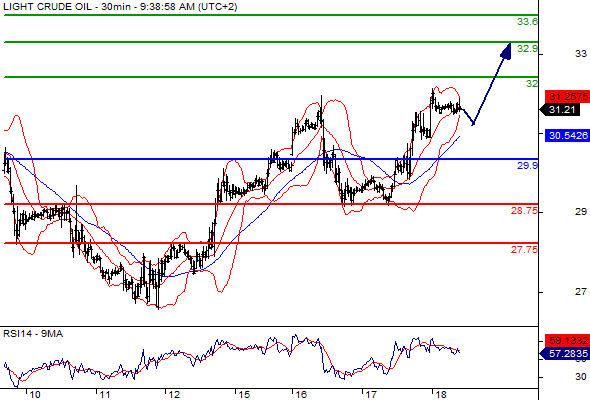
Crude Oil (WTI) (H6) Intraday: bounce.
Pivot:
29.90
Most Likely Scenario
: long positions above 29.90 with targets @ 32.00 & 32.90 in extension.
Alternative scenario
: below 29.90 look for further downside with 28.75 & 27.75 as targets.
Comment
: the RSI is mixed to bullish.
To add comments, please
log in
or
register
Manual (гарын авлага)
My Trading
1
0
ALLYLLA PULLBACK BOT - Input & Setup Guide
My Trading
17
0
Keep your drawings when you change templates, profiles or restart MT5 and MT4
Trading Strategies
25
0
Multi-timeframe analysis on gold (XAUUSD): draw once on H4, trade on M15
Trading Strategies
24
0
How to sync the crosshair, scroll and zoom across charts in MT5 and MT4
Trading Strategies
24
0
How to sync drawings across timeframes and charts in MT5 and MT4
Trading Strategies
22
0
Median vs Average Month in 8 EA Backtests: The Median Was 0.06x to 0.80x the Average; ETHEREUM TREND 0.13% vs 2.13%
Trading Strategies
34
0
Monthly report November 2026: all 11 live signals, with the weak ones
Statistics
33
0
Ultimate Weekday Reversal - User Guide
Trading Strategies
52
0
110
Gold Trend Matrix v.2.0 – FREE XAUUSD Trading Robot
76
Today’s Market Outlook November 10, 2026 Focus on month-over-month US CPI; Waller’s remarks lift USD/JPY back into the
134
How to Find Strong Support and Resistance Levels in Forex: A Practical Trading Guide
forex
technical analysis
eurusd
EUR/USD
gbpusd
gold
usdjpy
GBP/USD
usd/jpy
usd
Trading
AUD/USD
usd/chf
S&P 500
forecast
usd/cad
Fed
bitcoin
Fxwirepro
dax
fundamental analysis
VistaBrokers
Gold spot ($)
Silver spot ($)
Crude Oil (WTI)
USD/TRY
audusd
EUR
forex news
ECB