

“The Market’s primary job is to instantly find that exact place where this is an equal disagreement on value and an agreement on price.”
-Bill Williams, Trading Chaos
Understanding Support and Resistance
Trading CFDs is at the heart of pure investing where the goal is to buy low and sell high or buy high and sell higher. However, there is a simple place where many traders get into trouble with investing in CFDs or any other market. That troublesome place is when an investor comes to a decision that something will rise, so they buy ‘low’, without an objective point as to where their guess about a future will be negated or proven not worth the risk any more.
Support and resistance levels on a chart helps a trader answer the question, at what point is a trade not working? If a trader is buying a CFD contract, a price rise is the hopeful outcome and price breaking through resistance is the proof of a working or profitable trade. In other words, that trader was right to buy when they did and should consider holding onto the trade until levels of support begin to give way.
Recognizing Support Breaks Can Keep Traders Out of Pain

Past performance is no guarantee of future results.
One of the easiest ways to understand the principle of support and resistance is to think of support as a price floor and resistance as a price ceiling. In the same manner that the floor one is sitting on is supporting them, the price floor or support should hold price up and should it break, then the immediate outlook is that buyers may exit the market as weakness is present. This has recently happen with Oil and the breaking of price support has caused buyers to exit causing a near free-fall as Oil has fallen nearly 25% from the highs of 107.64 in summer of 2014.
Ideally, a trader would like to see price continually bounce higher off a common price area to identify support or bounce lower at a specific price area to identify resistance. This reaction level can show someone that traders appear unwilling to buy or sell through a specific level. In the simplest form, support can be the most recent low because an inability to break below a recent low would signal that the market has reached a point where buying demand exceeds selling pressure and a move lower is not favorable or probable until support breaks. A buyer of a CFD contract can put a stop below recent support because like the picture of US Oil above, when support breaks, the fall can be dramatic and fast.
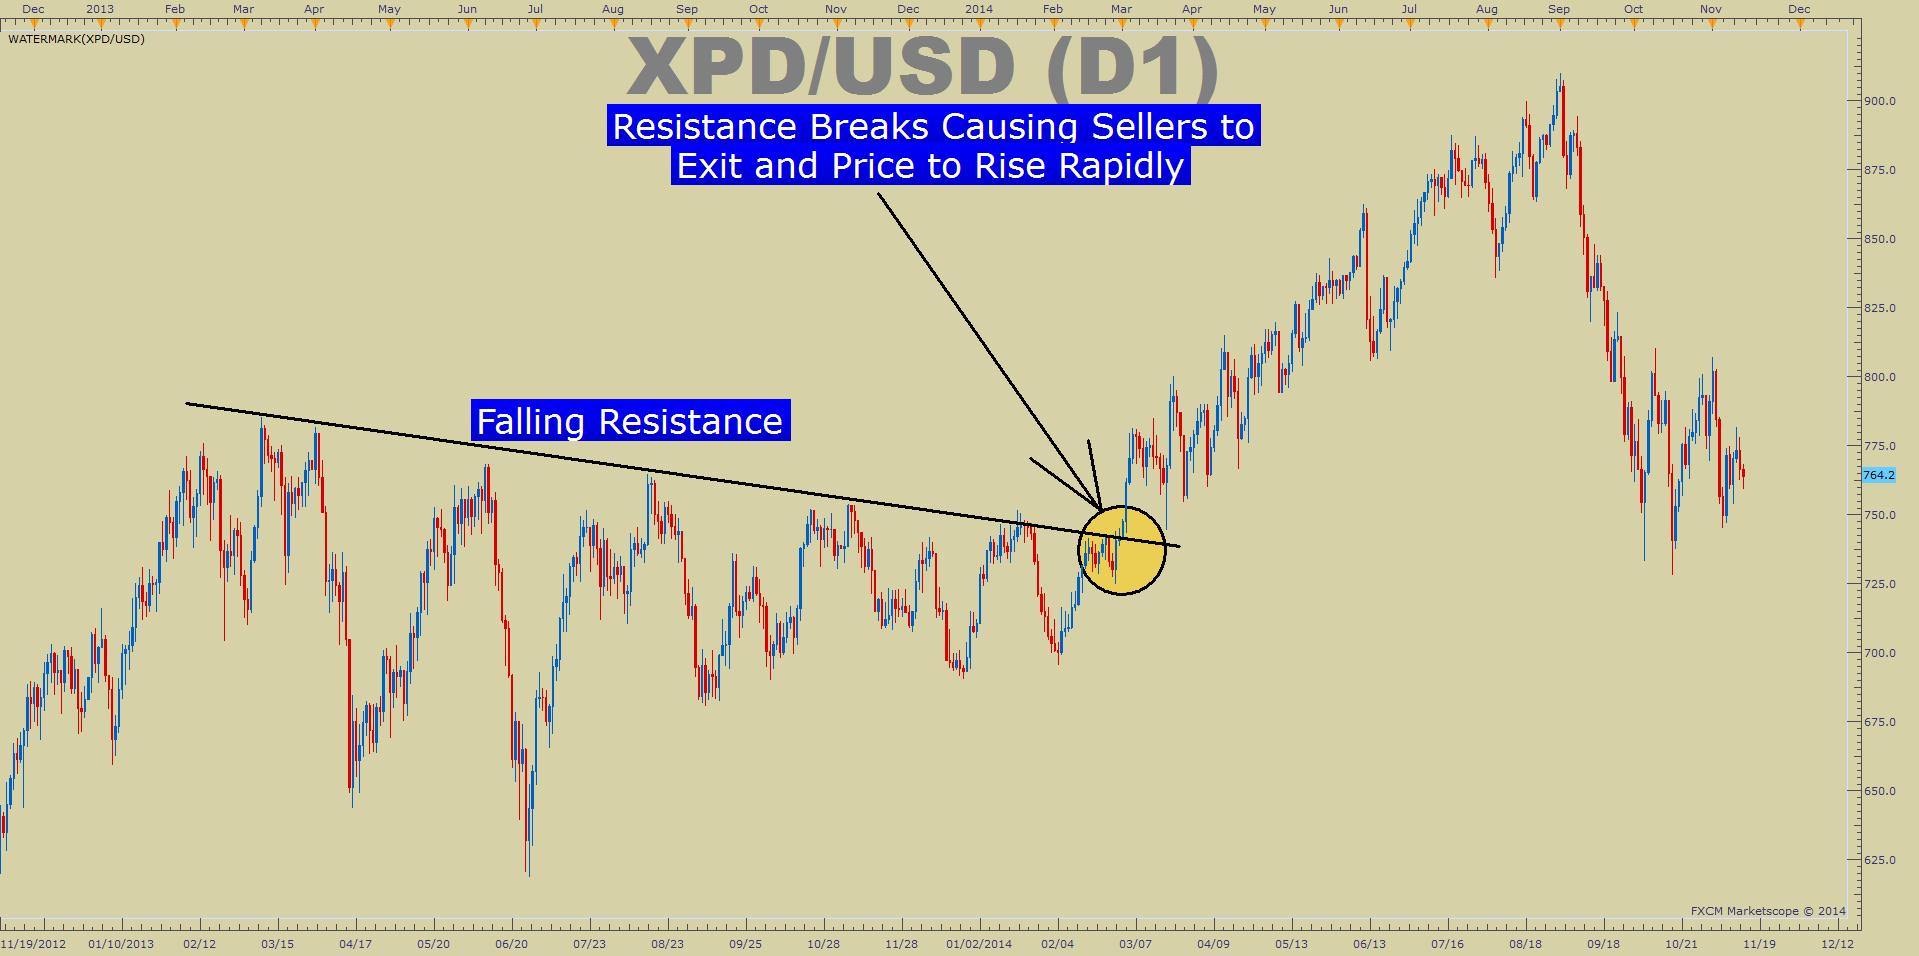
Recognizing Resistance Breaks is Also Important
Past performance is no guarantee of future results.
If a trader is selling or going short a CFD, they can look for resistance, which can be a series of highs or peaks in a common price area, or as simple as the previous market high. Similar to support, when a resistance level holds, that market is telling them they’ve found a level where selling demand exceeds buying pressure and a rally will not continue. A seller of a CFD contract can put a stop above recent resistance because like the picture of XPDUSD above, when resistance breaks, the subsequent can be dramatic and fast.
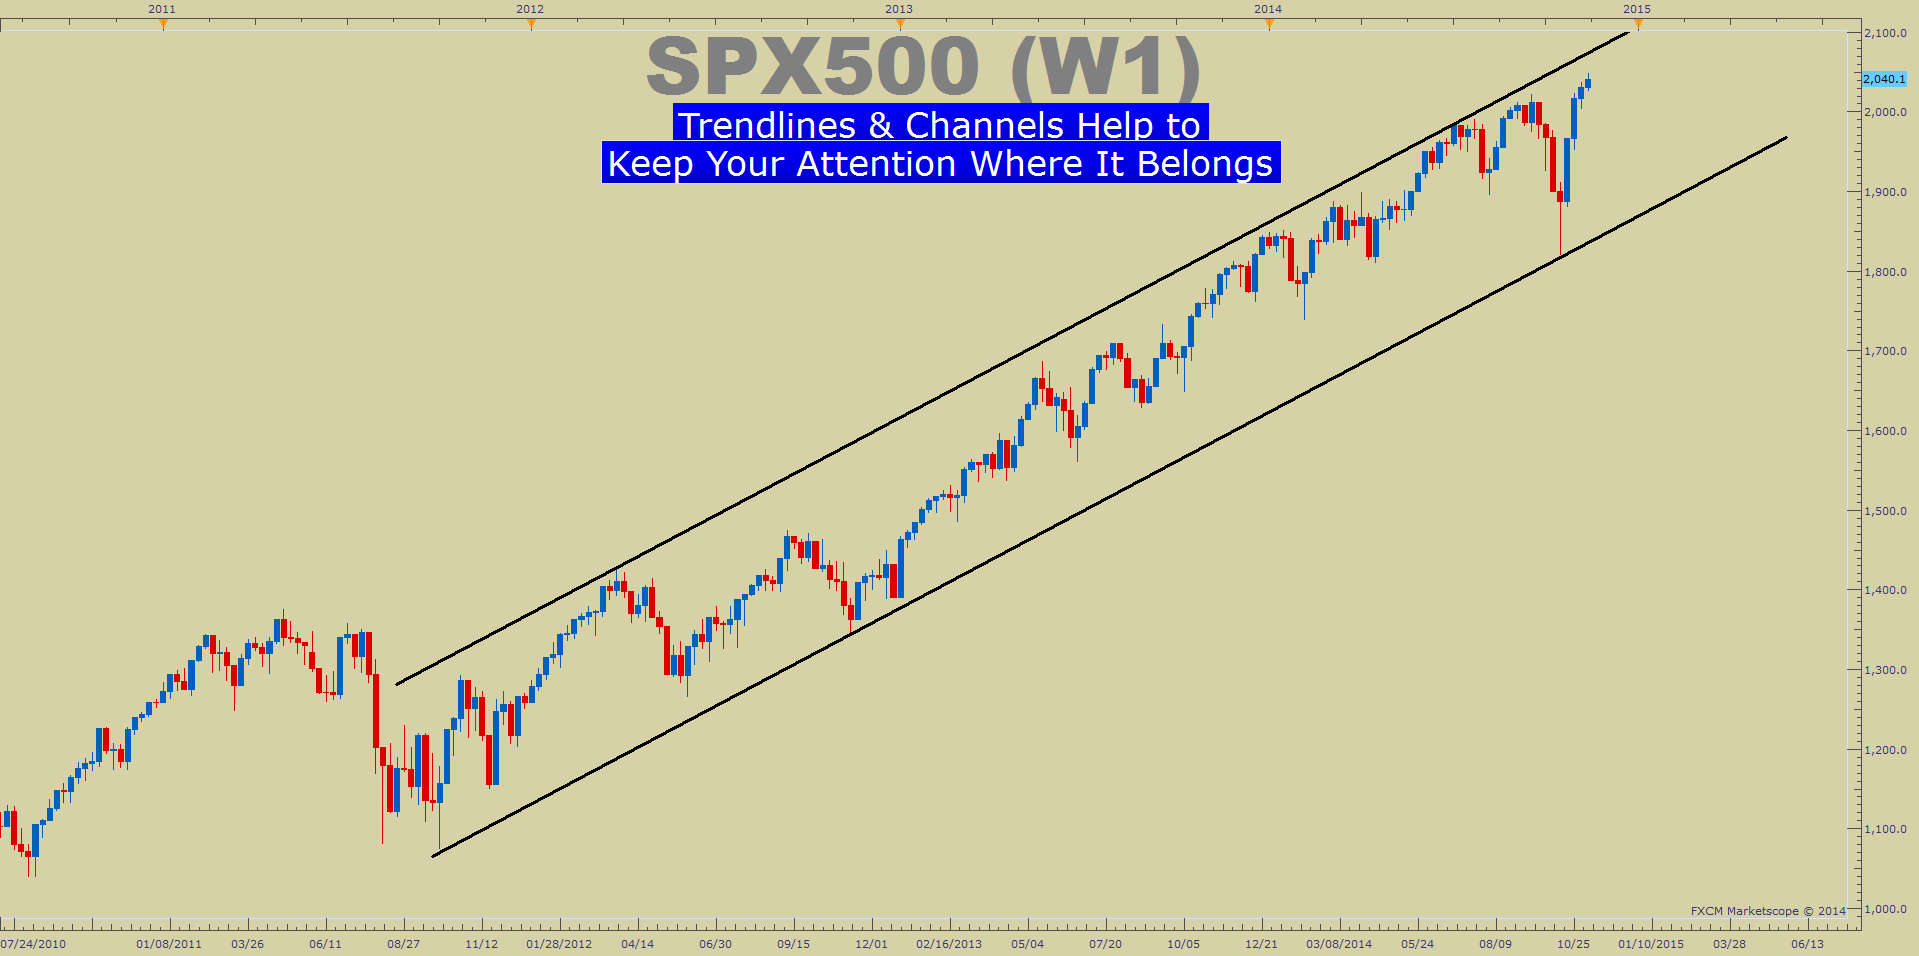
Trendlines & Channels: Moving Support & Resistance
One of the easier and more effective ways to begin trading CFDs or any market is to utilize trendlines. Trendlines are a line drawn, as seen on the charts above that connect recent peaks of resistance or recent lows of support. It’s important to note, that they should not be forced but act as a map or guideline to how the market is behaving in its most primal form. A higher trendline, drawn by connecting higher lows, means there’s more buying pressure and that selling is a futile or low probability event. A rising lower trendline, drawn by connecting lower highs, means that there’s more selling pressure and that buying is an unfavorable event.
Trendlines Keep The Focus on the Trend and not on Guessing
Past performance is no guarantee of future results.
Another benefit to CFD investing with trendlines is that they can indicate when moving levels of support or resistance are broken. Once support and resistance are broken, the functions will often reverse roles. In other words, a trader may recognize a broken level support becomes a new resistance level above the market. A broken resistance level over the market functions as support below the market. When a support or resistance level has been recently tested and held, the more power it exerts on subsequent market action. This is because many of the trades that helped form the support and resistance levels are still in play and are likely to encourage future trading decisions.
Another tool that CFD traders can use is Channel Lines. Channel lines are straight lines that are drawn parallel to basic trendlines explained earlier. A rising channel line should be drawn above the price action, maybe connecting prior highs and parallel to the basic trendline that connects higher lows. A bearish or falling channel line would be drawn below the price action and parallel to the down trendline (which is above the price action). Markets often trend within these channels and the chartist can use that knowledge to their advantage by knowing in advance where support and resistance could lie.
One rule that CFD traders can hold on to is that the longer a trendline has been in effect and the more times it has been tested, the more significant it becomes. Subsequently, the breaking of a long-term trendline is often the best warning of a reversal in a strong trend.
Building a Trading View Based on Support and Resistance
As mentioned above, any CFD trader new or experienced will soon find that reacting to the market is much better than trying to predict it. Markets are nearly impossible to predict but easy to react to and trendlines favor that truth.
When a trader decides to trade a CFD, their first task should be to find support and resistance levels. Ideally, they should look to buy near tested support levels that have recently held. For sellers of CFDs, the best place to sell is near resistance levels that have recently held. The levels that they identify as support and resistance should remain on their radar because after support has been broken, it can and often will provide resistance on future pullbacks. In other words, the old “low” that they may have bought a CFD contract on becomes the new high. As the famous humorist, Will Rogers once said, “Don’t gamble; take all your savings and buy some good stock and hold it till it goes up, then sell it. If it don’t go up, don’t buy it.”


")
![[XAUUSD]: Weekly Liquidity Activation Points (timings), June 22-26, 2026](https://c.mql5.com/6/1013/splash-preview-771790.png "[XAUUSD]: Weekly Liquidity Activation Points (timings), June 22-26, 2026")
