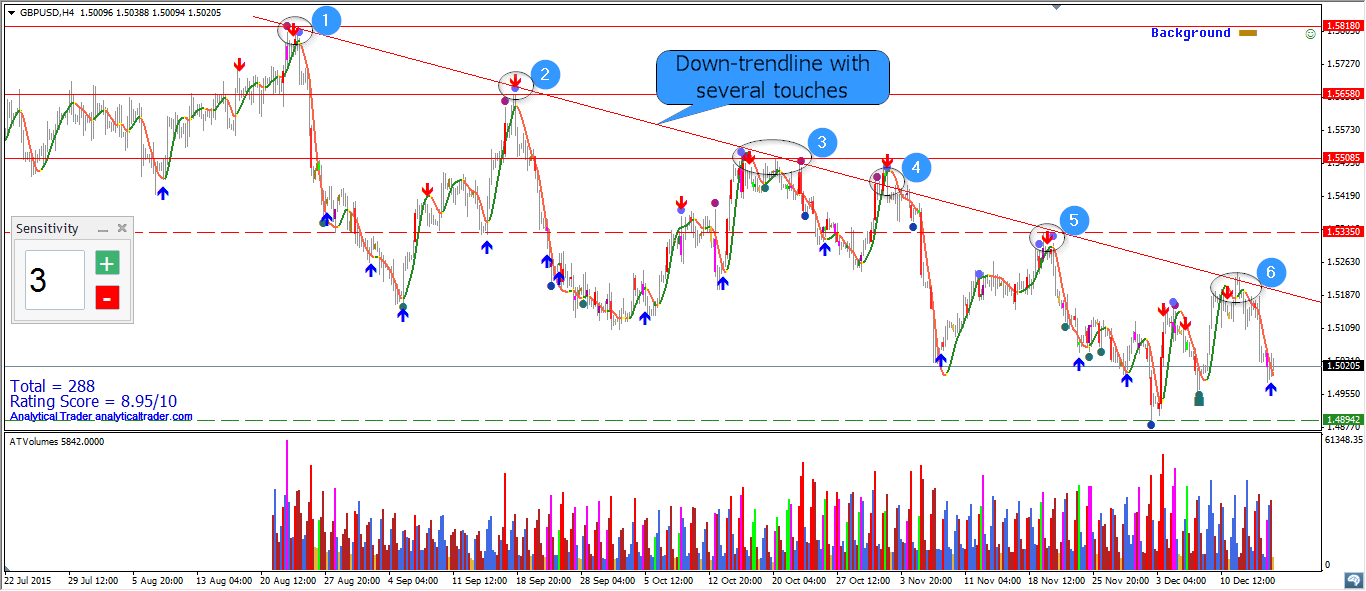
GBPUSD is moving down and it is possible to draw a down-trendline with several touches. Market already turned six times near this line. Therefore it represents resistance to higher prices. The longer line is acting as resistance, the stronger it becomes and more difficult it will be to cross this resistance. Many traders have already detected this pattern and adjusted their trading accordingly. If professionals want higher prices, they will have to absorb selling from these traders. Volume in this case has to be high. Weak signals from VSA or Reversal signals will help you to understand whether the resistance will work this time or it will be broken.

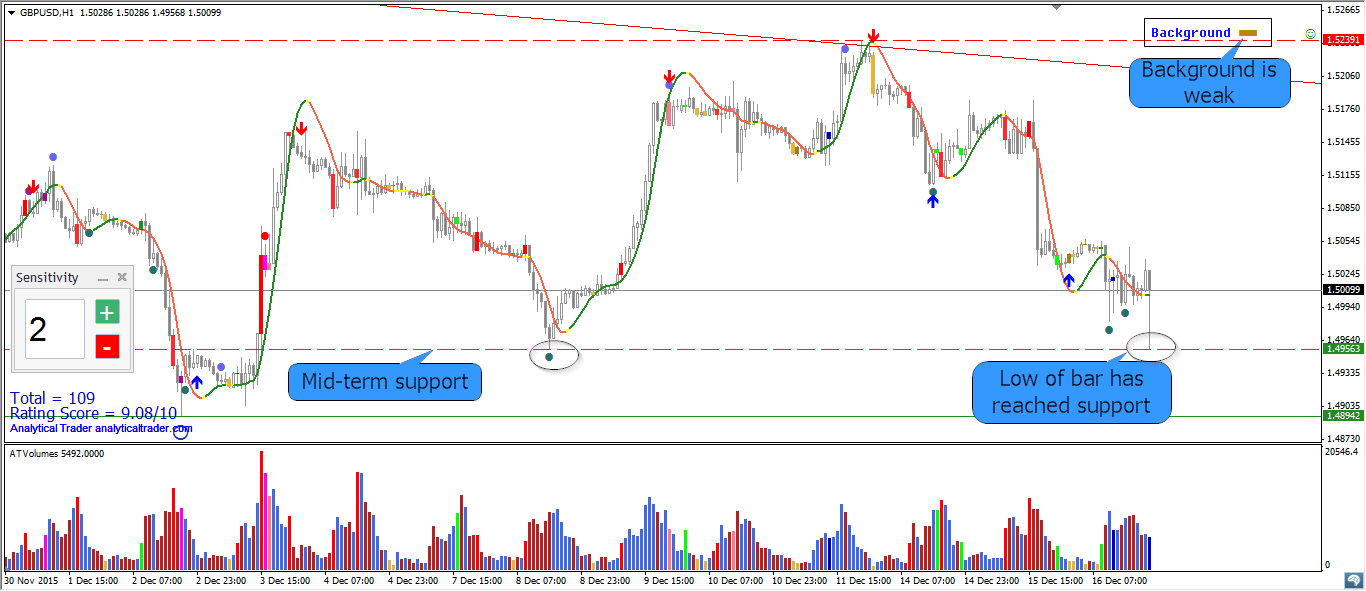
What is interesting in H1 timeframe: low of last bar is exactly at the level of mid-term support (previous low).


