
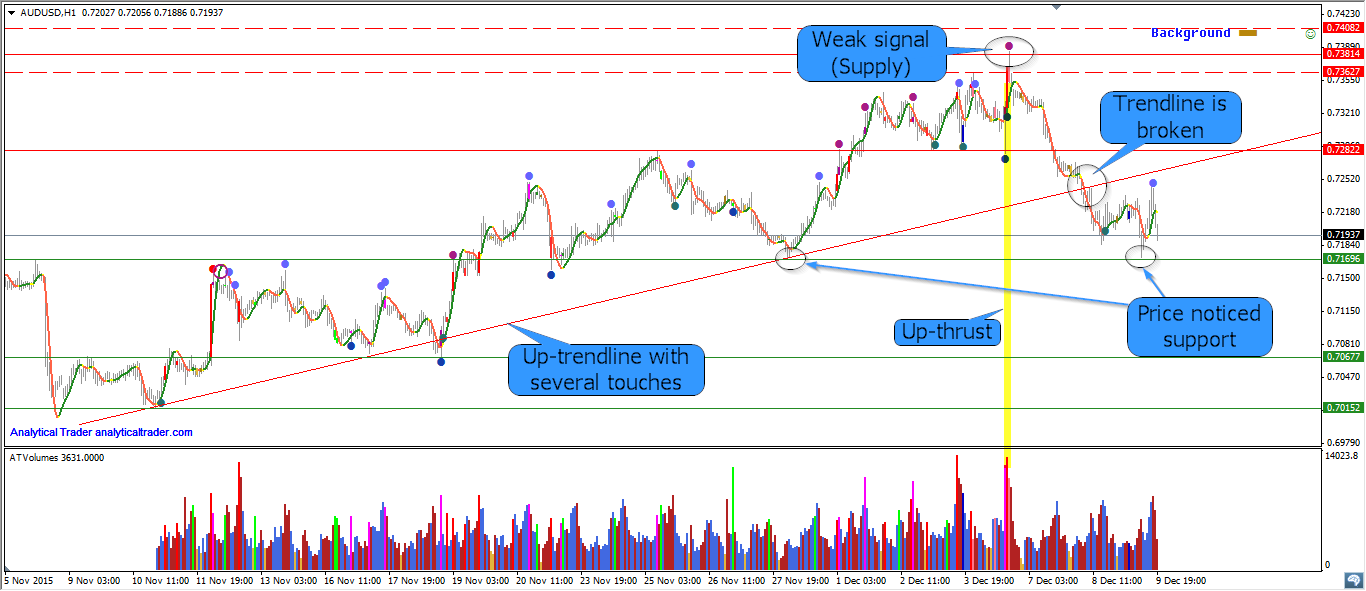
I would like to start this analysis from lower timeframe. AUDUSD was moving in up-trend and it was possible to draw an up-trendline with several touches supporting lows of each down move. On Friday (04.12.15) we had high activity on the top of the market (look at the volume and spread). Then up-thrust happened. Up-thrusts can be recognised as a wide spread up-bar, accompanied by high volume, to then close on the low. Up-thrusts are usually seen after a rise in the market, where the market has now become overbought and there is weakness in the background. Up-thrusts are frequently seen just before a down-move. Analytical Trader has also detected weak signal (Supply) on this bar. The market started to move down. The trendline was crossed without any problems (there were no strong signals which would suggest that buying has entered the market. Price stopped near support (previous low), but I do not think that mark-down is over.
Let’s move to higher timeframe.
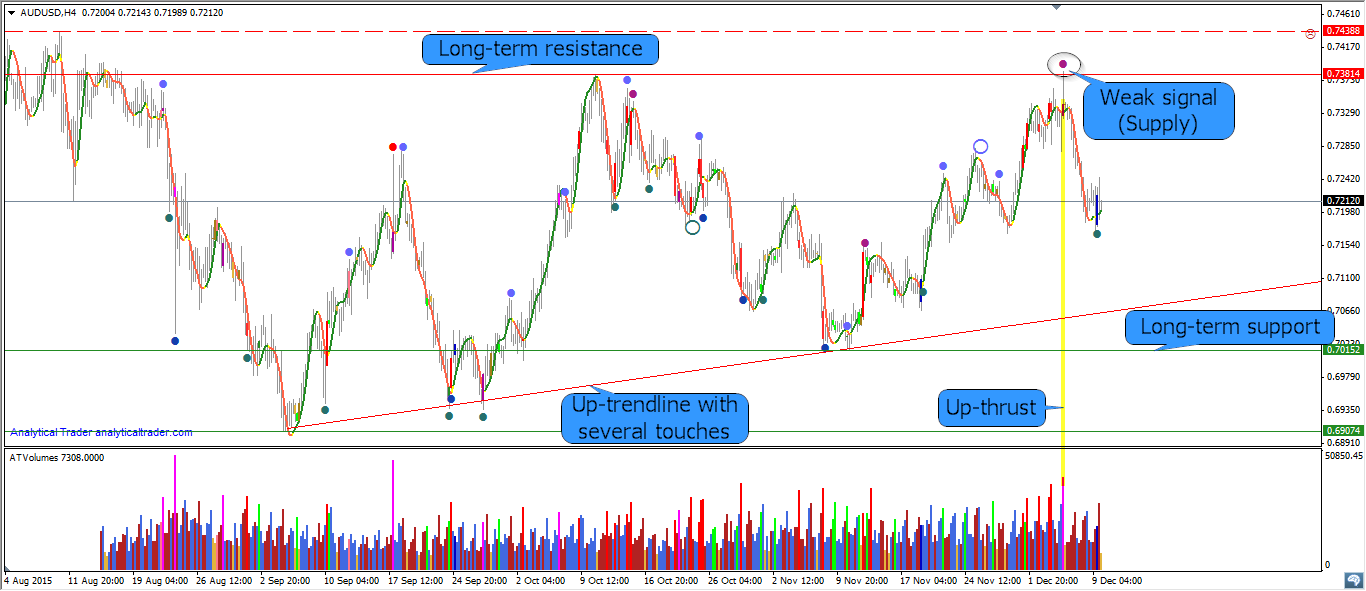
I would like to draw your attention to several things in H4 timeframe:
- High of up-thrust is slightly higher than long-term resistance (previous maximum). Usually traders place stop-losses at this level or buy-stops to open a long trade in this place. In our case the stop- losses were activated, long trades were opened, but the market has immidiately turned down leaving the traders with losses. This is a quite reliable setup after which we can expect prices to fall.
- It is possible to draw another trendline with several touches. I would recommend to watch price action as the market approaches this line. The trendline and long-term suport are potential places for price reversal.


