
USD/CAD Price Action Analysis - long-term uptrend with possible bullish breakout
5 October 2015, 12:11

0
1 385
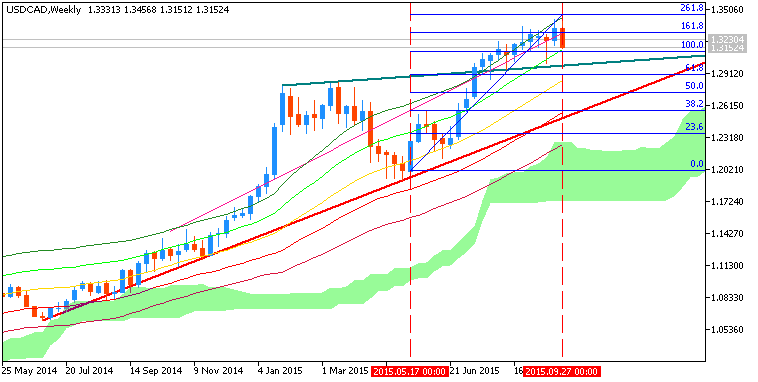
W1 price is on bullish market condition located above Ichimoku cloud and above 200 period SMA
(200 SMA) and 100 period SMA (100 SMA):
- Ichimoku cloud is located far below the price which makes the reversal of the price movement to the primary bearish market condition to be very unlikely in the near future.
- The price is ranging between Fibo resistance level at 1.3456 and 23.6% Fibo support level at 1.3092.
- Ascending triangle pattern was formed by the price with 1.3353 resistance to be broken from below to above for good possible breakout.
- "After printing at 11 year low, USDCAD is about to take out last week's low signaling a turnaround in the Loonie. In fact, a close below 1.3175 would set-up a bearish key week reversal, an ominous ending pattern on weekly candles. This incredibly strong trend looks to be wobbling and could retest recent support of 1.30 and 1.2950 on a confirmed. Many traders been excited about this because of oil'sdemise, but a break of those key levels will call into question the structural integrity of the uptrend and likely attract more sellers."
- "The exact level of focus is 1.3012, the September low and recent low we
saw that respected the 1.2950 previous low. The 1.2950 low came at
multiple technical confluence points showing that the bounce respected
the larger trend. Considering the follow through move off 1.2950 gave us
11-year highs it’s easy to see this as key resistance. We’re working on
our 3rd lower day, which we have seen since the end of August. Focus
now will be on 1.2950 where a break would significantly damage the
immediate view higher."
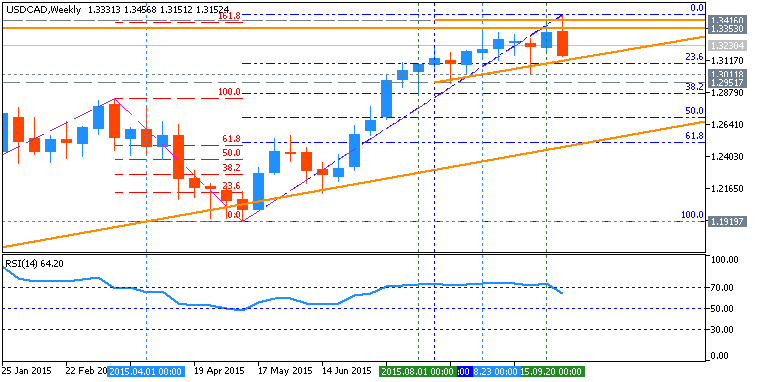
Trend:
- D1 - ranging bullish
- W1 - bullish
- MN1 - bullish


")
 & AMD Framework")