
USD/CHF Price Action Analysis - ranging between 50.0% Fibo level and key resistance for direction
31 July 2015, 09:11

0
881
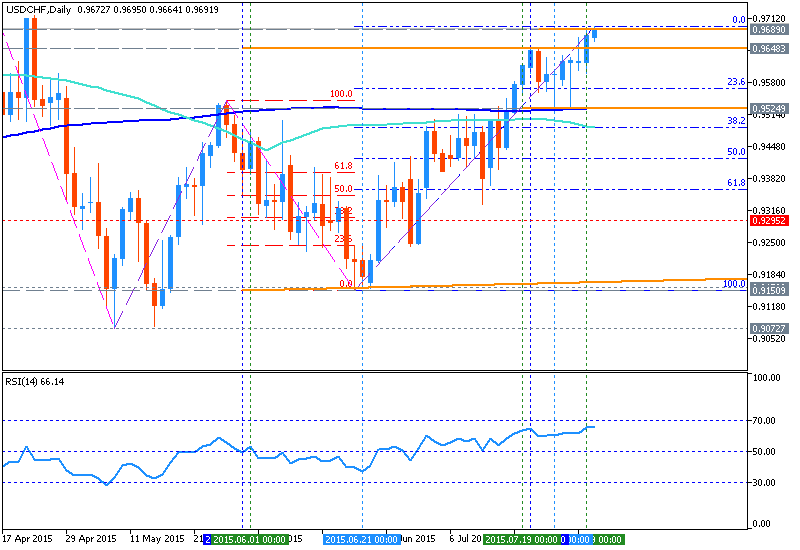
D1 price is located above 200 period SMA (200-SMA) and 100 period SMA (100-SMA) for the primary bullish with secondary ranging between 50.0% Fibo support level at 0.9422 and resistance level at 0.9918:
- daily price is trying to cross Fibo resistance level at 0.9694 on close daily bar for the bullish trend to be continuing;
- the price is ranging between 50.0% Fibo support level at 0.9422 and resistance level at 0.9918;
- "US Dollar resumed its move higher against the Swiss Franc, issuing the strongest daily close in three months. Near-term resistance is at 0.9712, the 38.2% Fibonacci expansion, with a break above that on a daily closing basis exposing the 50% level at 0.9770."
If the price will break 50.0% Fibo support level at 0.9422
together with 100-SMA and 200-SMA so we may see the reversal of the price movement to the primary bearish market condition.
If the price will break resistance level at 0.9918 from below to above so the primary bullish trend will be continuing with good possible breakout of the price movement.
If not so the price will be ranging between between support level at 0.9422 and resistance level at 0.9918.
Trend:


")
 & AMD Framework")