
Technical Analysis for US Dollar, S&P 500, Gold and Crude Oil - Rebound from Mid-January Low for crude oil

Prices declined to a three-week low after breaking range support. A daily close below the 61.8% Fibonacci retracement at 11790 exposes the 76.4% level at 11731.
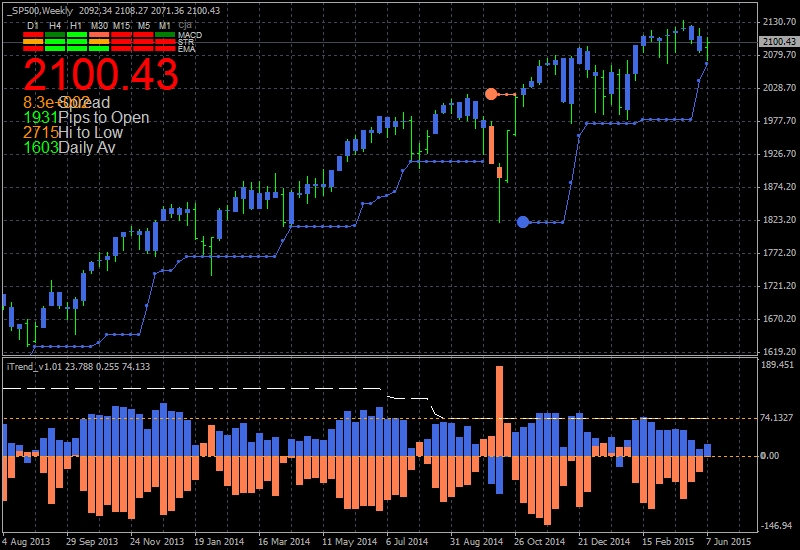
S&P 500 TECHNICAL ANALYSIS
Prices launched a swift recovery after testing rising trend line support
set from late-March lows. From here, a break above trend line
resistance at 2110.80 exposes the 50% Fibonacci expansion at 2119.10.
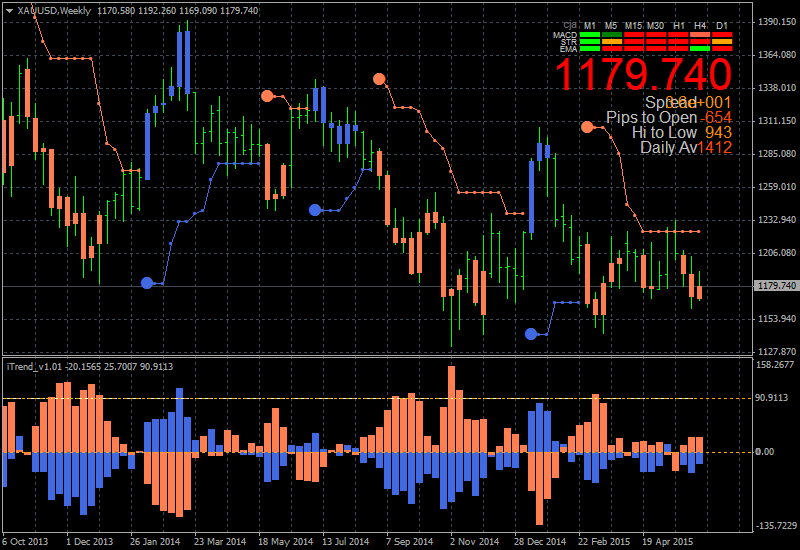
GOLD TECHNICAL ANALYSIS
Prices narrowly edged above falling channel resistance, warning that the
down move from mid-May highs may be unraveling. A break of trend line
resistance at 1201.51 exposes the May 18 high at 1232.30.
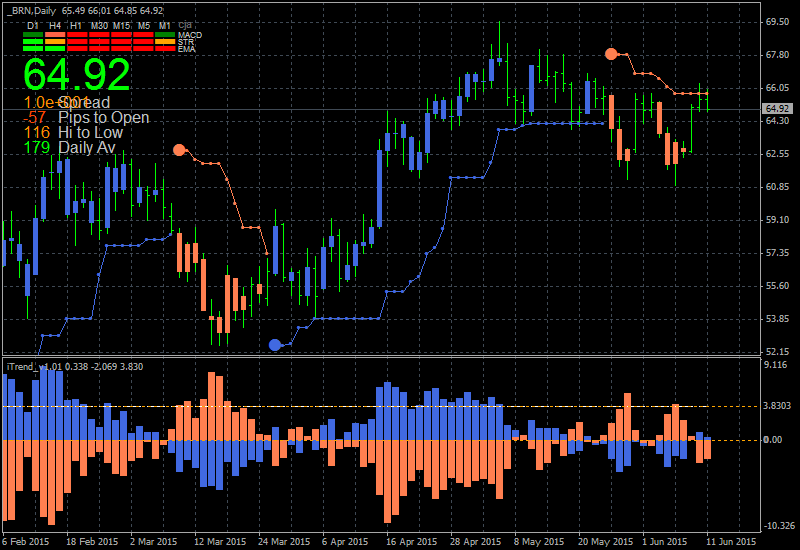
CRUDE OIL TECHNICAL ANALYSIS
Prices may be resuming the recovery launched from mid-January lows after
completing a Flag continuation pattern. Near-term resistance is at
66.69, the 23.6% Fibonacci expansion, with a break above that exposing
the 38.2% level at 70.25. Alternatively, a move below trend line support
at 62.62 targets the 38.2% Fib retracement at 60.27.


")
![[XAUUSD]: Weekly Liquidity Activation Points (timings), June 22-26, 2026](https://c.mql5.com/6/1013/splash-preview-771790.png "[XAUUSD]: Weekly Liquidity Activation Points (timings), June 22-26, 2026")
")