

Risk Factor
Keep in mind that backtesting statistics look solely at past performance. It's important to mention that past performance is not indicative of future results.
With that said, the very first thing many traders look for, and this is rather intuitive, is: How well has this EA performed in the past? Obviously it's important to look for one that has shown profitable results, but stopping there could lead to some detrimental results. These returns need to be adjusted for risk. If the Metatrader EA has shown some eye opening profits, but took on a ton of risk, these returns may not have been worth your while. To quantify profitability while also considering the risk taken on by the EA, many traders look at a statistic known as the “Profit Factor.”
Profit Factor
This ratio essentially shows you how much you can expect to gain for each dollar put into the account, over how much you're at risk of losing. The profit factor is calculated as:
(profit - commission)/(max drawdown + commission)
Metatrader EA with a profit factor less than 1 is a historically poor performing EA. The returns that it has produced do not justify the amount of risk taken on. Take a look at the table below for statistics of three hypothetical Metatrader EAs.
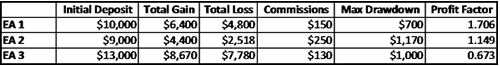
As you can see from this table, EA 3 has a profit factor less than one, and can be immediately eliminated from your decision. If you look closely, EA 3 actually was profitable (Total Gain - Total Loss = $890), however this return does not justify the amount of risk (drawdown) taken on.
The risk measurement that many traders tend to focus on are the drawdowns that the Metatrader expert advisor has produced.
Drawdown Analysis
When first analyzing the drawdowns of an EA, a good place to start is simply by looking at the equity curve. An EA with a choppy and sporadic equity curve shows a historically volatile EA; whereas a smoother equity curve shows a historically more stable EA.
There are three measures that many traders look at.
- Max Drawdown:
- This is the largest drawdown (in percentage terms) that the EA has realized over its trading life
- This is the best indicator of a worst case scenario
- A good way to think about this is: If this drawdown occurred immediately after opening your account, could you stomach this type of risk?
- Average Drawdown:
- The average drawdown size (in percentage terms) realized by the EA over its historical performance.
- Calculated by summing up all the losses (%) and dividing by the actual number of losses.
- In most cases this statistic can be provided by your EA vendor
- The average drawdown will give you an idea of what you might typically see (on average) in a peak-to-trough cycle.
- Drawdown Recovery:
- Shows the time frame the trading robot has taken, on average, to recover from a drawdown back to a positive balance.
- A less volatile Metatrader expert advisor will often take longer to recover.
- Keep this in mind before deciding that a fast recovery is a good attribute.
- More volatile EAs often recover quicker, but this is due to large fluctuations and swings in performance.
These risk measurements will certainly be helpful when selecting the
right EA for you. Keep each of these risk statistics in mind when
analyzing any Metatrader EA, and always evaluate how they fit your
personal risk tolerance.
Examples
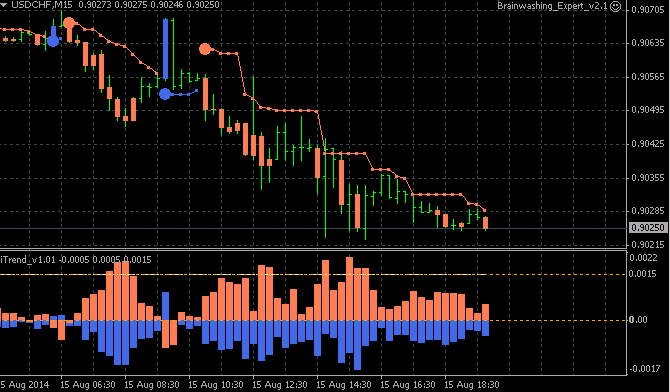
Brainwashing EA: classical way of trading (1 trade per symbol, no martingale, no scalping)
Control EA: martingale
TickScalper EA: martingale scalping (very high risk)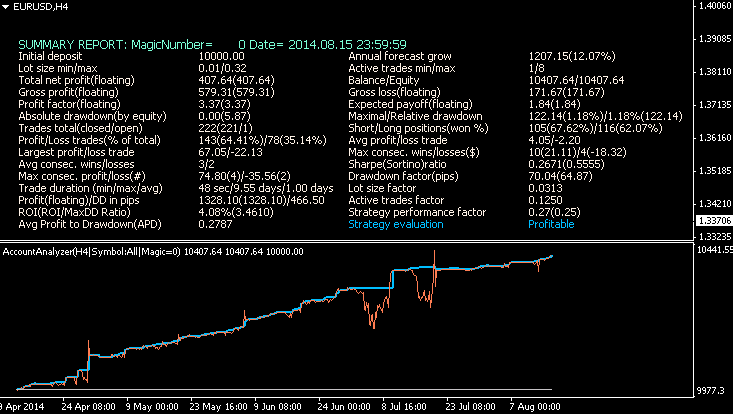
More to read
- How to Order an Expert Advisor and Obtain the Desired Result
- How to Post a Product in the Market
- How to Test a Trading Robot Before Buying
- Guide to Testing and Optimizing of Expert Advisors in MQL5


")

![[XAUUSD]: Weekly Liquidity Activation Points (timings), June 22-26, 2026](https://c.mql5.com/6/1013/splash-preview-771790.png "[XAUUSD]: Weekly Liquidity Activation Points (timings), June 22-26, 2026")