HOW TO TRADE: Stochastic Momentum Index Indicator - Video Manual and The Book To Read
KEY POINTS REGARDING THE STOCHASTIC MOMENTUM INDEX
- Introduced by William Blau in 1993 as a faster, less erratic version of the traditional stochastic oscillator
- Evaluates the Current Close relative to the midpoint of the Recent High/Low Range instead of simply the High and Low, and graphs this value along with a moving average (Stochastic %D)
- Helps predict turning points and duration of current price move
- Best
used alongside a way to predict trendiness of market (like Chande
Momentum Oscillator or R-Squared); like other oscillators, the indicator
calculates the direction of an emerging trend, but does not generate
reliable signals in a trending market
CALCULATING THE STOCHASTIC MOMENTUM INDEX
First
select a period N; then, determine the center (C) of the range during
this period by adding the highest high and lowest low within the period
and dividing the sum by 2
C = (HMAX + LMIN)/2
Now subtract this C from the current close (CC) to get D, the "distance":
D = CC--C
The indicator smooths the distance value twice (DS1 and DS2) with a 3-period EMA:
DS1 = EMA(3)(D)
DS2 = EMA(3)(DS1)
Now
smooth the difference between HMAX and LMIN twice (DHL and DHL2), using
the earlier EMA, and dividing the second result by 2:
DHL = EMA(3)(HMAX -- LMIN)
DHL2 = EMA(3)(DHL)/2
We can now calculate today's SMI value:
SMI = 100 * (DS2/DHL2)
READING THE STOCHASTIC MOMENTUM INDEX
An extreme position (approaching -100 or +100) implies the likelihood of a reversal
Common trading level: Overbought (bullish) above +40 / Oversold (bearish) below -40
Basic turning point signals:
- Buy when the indicator rises above -40 from below
- Sell when the indicator moves below +40 from above
- Cross-over 1: SMI passes moving average from below = Buy
- Cross-over 2: SMI falls below moving average from above = Sell
- (Cross-overs that occur between -15 and +15 are often unreliable)
Divergences
are uncommon, but can be used to check signals or produce strong
signals: Buy for bullish divergence, sell for bearish
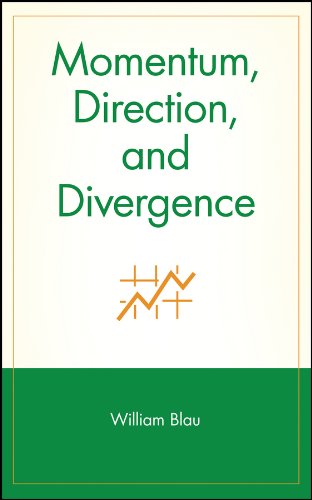
Momentum, Direction, Divergence : William Blau

In this latest volume, technical expert Bill Blau shows you how
momentum, direction, and divergence form the basis of most technical
indicators and how they can work for you to provide a considerable
competitive advantage. Clearly, concisely, and with a minimum of complex
mathematics, Blau shows you how to understand and apply them.
Integrating the latest financial insights with more than 75
easy-to-follow graphics, Blau describes the uses and limitations of many
of today's most notable technical indicators. He then demonstrates a
variety of ways in which the principles of momentum, direction, and
divergence can be used to create a versatile new set of technical
indicators or to improve the effectiveness of the most widely used
traditional indicators.
Focusing on the groundbreaking double smoothing concept, which he introduces for the first time in this book, William Blau:
- Develops reliable new momentum indicators based on double smoothing techniques
- Shows how these indicators improve the effectiveness of most popular oscillators, including the RSI, MACD, and stochastic indicators, by solving a host of timing problems
- Combines the standard Welles Wilder techniques with his original True Strength Index to improve the effectiveness of most directional movement indicators
- Introduces new ways of identifying divergence that make implementation simpler than ever
- And much more
==========
William Blau's Indicators and Trading Systems in MQL5. Part 1: IndicatorsThe first part of the article "Indicators and Trade Systems in MQL5 by William Blau. Part 1: Indicators " is a description of indicators and oscillators, described by William Blau in the book "Momentum, Direction, and Divergence".
The article describes the following groups of indicators:
- Indicators, based on the Momentum:
- Momentum (Blau_Mtm.mq5)
- The True Strength Index (Blau_TSI.mq5)
- Ergodic Oscillator (Blau_Ergodic.mq5)
- Indicators, based on Stochastic:
- Stochastic (Blau_TStoch.mq5)
- Stochastics Index (Blau_TStochI.mq5)
- Stochastic Oscillator (Blau_TS_Stochastic.mq5)
- Indicators, based on the Stochastic Momentum:
- Stochastic Momentum (Blau_SM.mq5)
- Stochastic Momentum Indicator (Blau_SMI.mq5)
- Stochastic Momentum Oscillator (Blau_SM_Stochastic.mq5)
- Indicators, based on a Mean Deviation from the market trends:
- Mean Deviation Index Indicator (Blau_MDI.mq5)
- Ergodic MDI-oscillator (Blau_Ergodic_MDI.mq5)
- Indicators based on the Moving Average Convergence/Divergence:
- MACD indicator (Blau_MACD.mq5)
- Ergodic MACD-oscillator (Blau_Ergodic_MACD.mq5)
- Indicators, based on the Candlestick Momentum:
- Candlestick Momentum (Blau_CMtm.mq5)
- The Candlestick Momentum Index (Blau_CMI.mq5)
- Candlestick Index Indicator (Blau_CSI.mq5)
- Ergodic CMI-Oscillator (Blau_Ergodic_CMI.mq5)
- Ergodic CSI-Oscillator (Blau_Ergodic_CSI.mq5)
- Indicators, based on a Composite High-Low Momentum:
- Indicator of the Virtual Close (Blau_HLM.mq5)
- Directional Trend Index Indicator (Blau_DTI.mq5)
- Ergodic DTI Oscillator (Blau_Ergodic_DTI.mq5)


