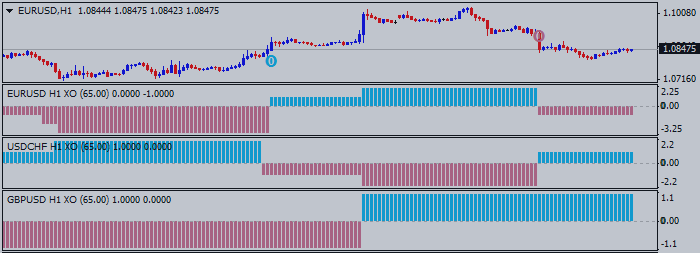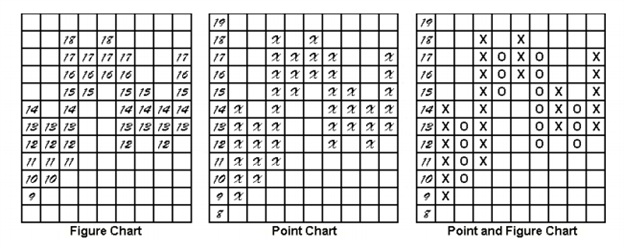
How To Trade - Point & Figure Chart: Introduction - Why Traders Use P&F Chart
There is no one person or the author credited for creating Point & Figure chart. Point & Figures were adapted from a method used by floor traders in the 19th and pre-computer 20th century. The basic premise that caused P&F to be born is that there needed to be a simple method for floor traders to record price action to analyze price without unnecessary noise.

"Due to technology, Point & Figure charts have fallen out of favor due to the likely fact that Point & Figure charts do not update in real-time, for a reason you’ll soon learn, and they may not appear as exciting as a short-term scalping chart. Point & Figure charts do not utilize time but only price. Therefore, you will not see a new candle print because there is a new day or time period like you do with candlestick charts. If price has not reversed or broken out from your predetermined levels discussed below, then there will be no change to the chart. In other words, the Point & Figure charts are famously objective."
There are 3 components to construct Point & Figure chart:
- Reversal Size Parameter
- Box Size Parameter
- Price Data used for Chart Construction


