

Introduction
Hello fellows traders,
I wanted to share a nice trading idea, according to my trading strategy,
who could bring some profits to your trading account with a minimum of risks.
The time frame used is the monthly chart, so prepare yourself to carry the trade during minimum a year!
The entry point, on the other hand, is on the short time frame, the 1H chart...So if the trade goes wrong, we will know it very quickly :)
Here is my own technical analysis knowing that I'm not paying attention to the fundamentals (and I never will).
The Monthly Chart
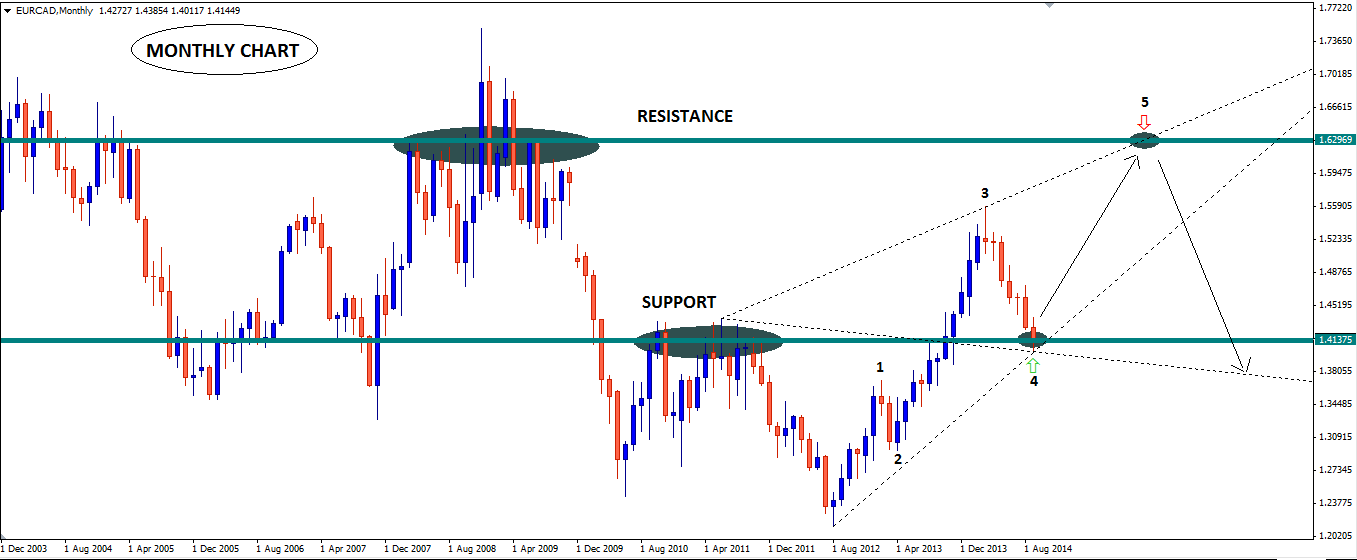
On the monthly chart we can see that the Euro is, at the moment, still on a bullish trend since the middle of 2012.
The down-move we are currently seeing can still be considerate as a correction.
this up-trend move broke, at the end of 2013, the Resistance without any weakness! This level became, today, potentially a new Support.
If we focus on the trend continuation and according tho the Elliott waves theory, we are now anticipating a final wave 5.
The price is now on the Support-level but not showing any reaction yet from the bulls on this particular time frame.
For the target, there is a beautiful convergence with an emerging Wolfe waves pattern, the 1.27 & 1.41 fibonacci extension (from point 3 & 4) and a Resistance level around 1.6300 CAD.
The 4 Hour Chart
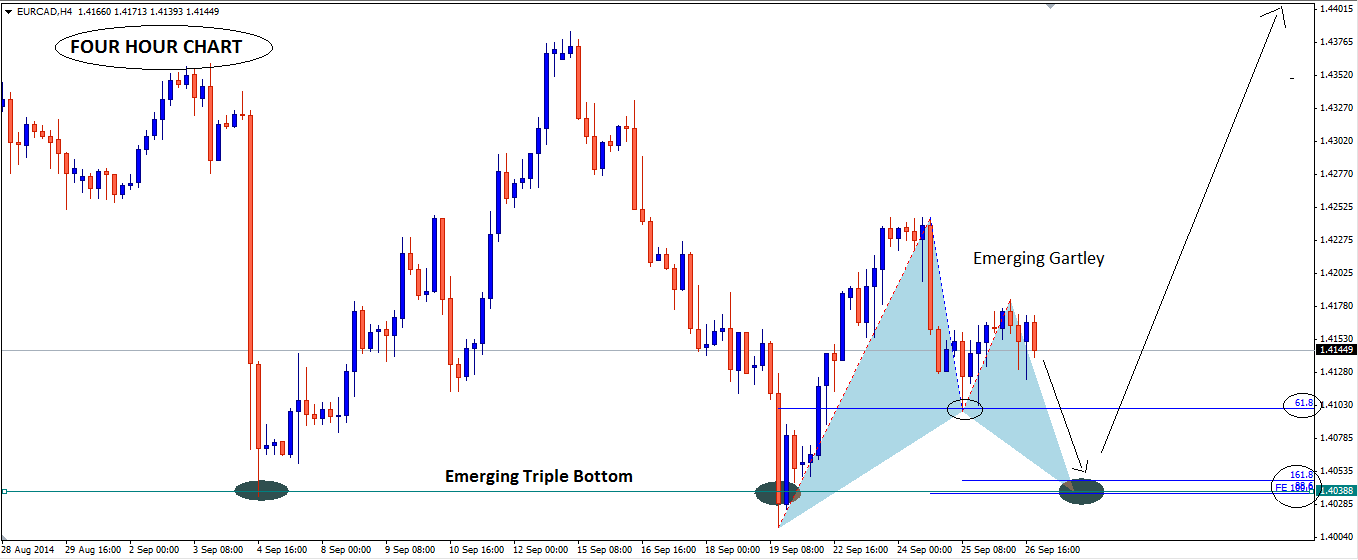
On the 4H chart, we can see a more choppy Market, and that's where we can look for patterns as an emerging triple bottom combined with a precise emerging Gartley pattern.
What appeal to me is this emerging Gartley pattern with a precise Fibonacci-cluster including the 0.886 retracement, the 1.618 extension and the AB=CD pattern! so that's where I will looking to enter the trade.
The stop-loss will be easy to place, because the Gartley pattern will be invalid if prices break the recent low.
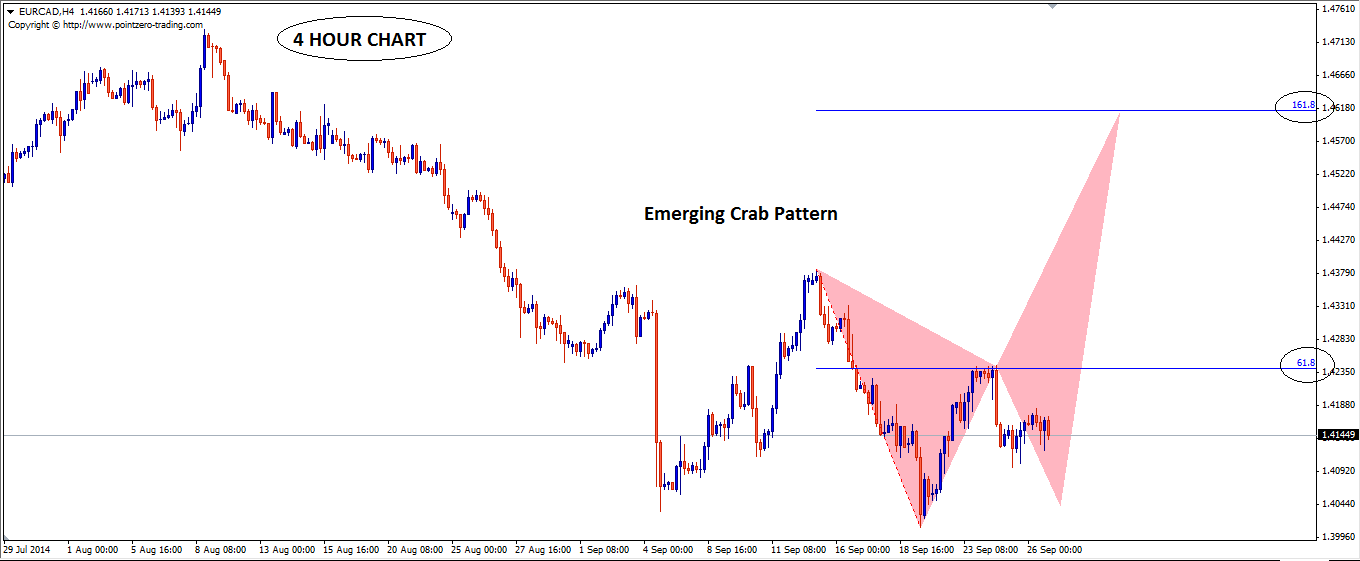
Another Harmonic pattern is emerging on this time frame, and it is a Bearish Crab pattern, I will use that too to set targets.
The 1 Hour Chart
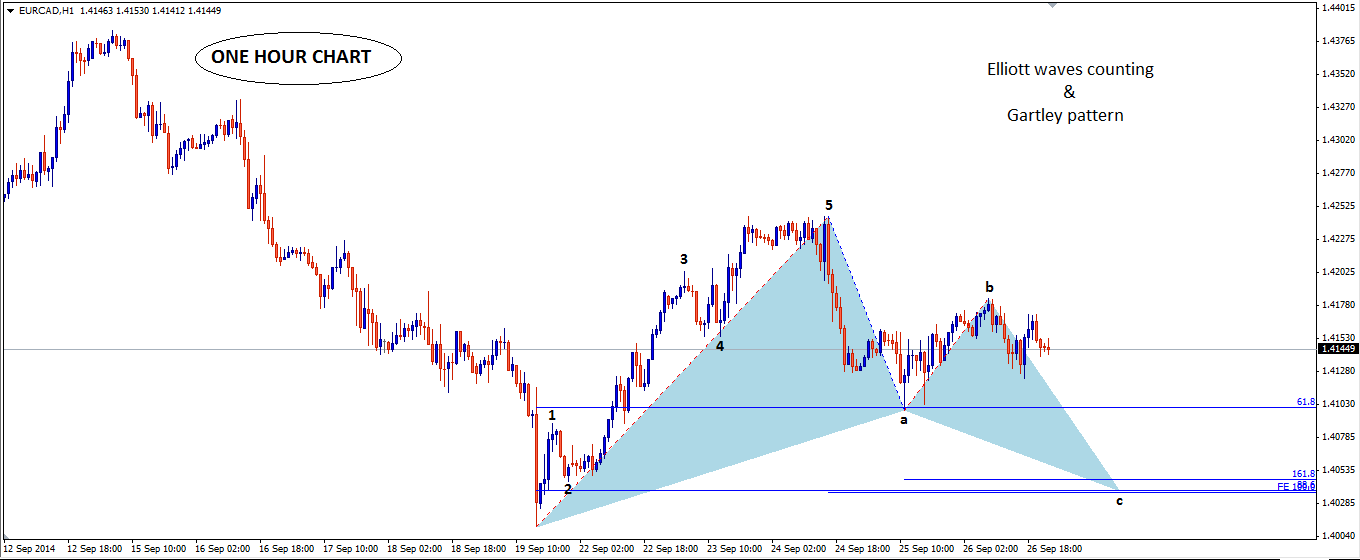
On the 1H chart, we can see a bullish Elliott waves structure respecting all the rules and levels.
Again, the emerging Gartley pattern appeal to me because of this precise convergence with the Elliott waves count (+ the triple bottom on the 4H chart!)
So I would be looking to enter this trade if prices reach 1.4039 CAD, but only with a price action confirmation or a fractal breakout!
2 Trades in one
With all that, I'm aware that prices could not follow my Long-term forecast, but still could be right for at least the short-term time frame.
So I'm gonna trade 2 positions in one... I normally risk 0,5% on any trade, so this time, I'll risk 1% but with 2 targets, one on the PRZ of the emerging Crab pattern, and the other one on the next Resistance level on the monthly chart (the carry trade).
Money Management
Like I said, the total risk will be 1% of my Capital with 2 different targets.
Trade N°1:
Entry: 1.4039
Stop-Loss: 1.3998
Target: 1.4613
------------------------
Risk: 41 pips (0,5%)
Reward: 574 pips (7%)
R/R ratio: 14
Trade N°2:
Entry: 1.4039
Stop-Loss: 1.3998
Target: 1.6295
------------------------
Risk: 41 pips (0,5%)
Reward: 2256 pips (27,5%)
R/R ratio: 55
Don't forget that this analysis is just a guess, and that everything can happen in the Markets! so manage your risks!!
Happy Trading!
Marco ESLAIT BRAND
From Trading an Edge


![[Two Different Approaches to Market Timing]: The Spiral Calendar and the VISTmany Research Project](https://c.mql5.com/6/1012/splash-preview-771691.png "[Two Different Approaches to Market Timing]: The Spiral Calendar and the VISTmany Research Project")
