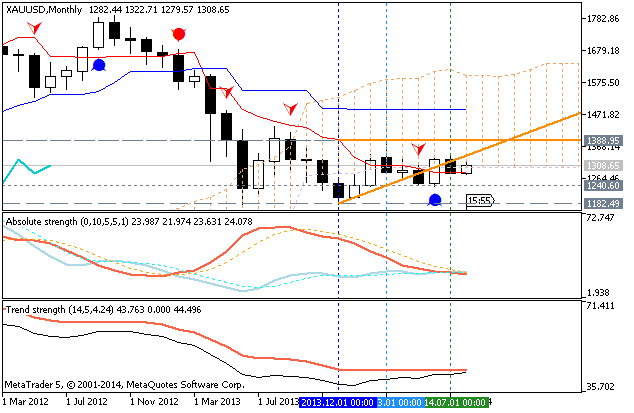
Based on this assessment, gold is not likely to post a strong rally unless the economy starts to weaken. This would push any plan by the Fed to raise interest rates deeper into 2015. The wildcard in this analysis may be a sharp plunge in the equity markets, or direct U.S. involvement in any of the military action taking place in Ukraine, Gaza, Syria or Libya. A steep decline is global equity markets could send investors into gold for safety, however, the U.S. is not likely to move troops or military equipment into any of the “hot zones”.

Technically, the main trend is down, but the market has been trapped
inside a major retracement zone for a little over a year. The main range
is the October 2008 bottom at $735.90 to the September 2011 top at
$1952.60. The retracement zone formed by this range that has been
providing both support and resistance since April 2013 is at $1341.80 to
$1198.20. The upper, or 50% level provided resistance in July.
The short-term range is $1181.30 to $1392.80. The pivot price of this
range is $1287.00. Gold has straddled this level six consecutive months.
How investors react to this level in August should set the tone for the
month.
The major support angle that has provided guidance and direction since
the $735.90 bottom comes in at $1295.90 in August. Since the market
closed at $1282.80 in July, it will begin the month on the weakside of
the uptrending angle, giving it a downside bias.
The monthly chart indicates there is plenty of room to the downside if
$1287.00 is taken out with conviction. A sustained move under this level
could trigger a break into the Fibonacci level at $1198.00. On the
upside, taking out the 50% level with better-than-average volume could
trigger a move into the major downtrending angle at $1392.60.
Watch the price action and order flow at $1287.00 this month. It should
let you know which way investors want to take this market.


