

Support and resistance levels are critical areas for scalpers to identify.
Price action, pivots, and moving averages can all be used to find these values.
Once identified, traders can then look to employ the strategy of their choosing.
One of the most important concepts a scalper needs to master is how to find levels of support and resistance. These levels will act as price ceilings and floors which will ultimately help us determine our scalping strategy.
While there are many ways to identify support and resistance, today we are going to take a look at three of the most common methods that can be applied in our day trading.
Price Action
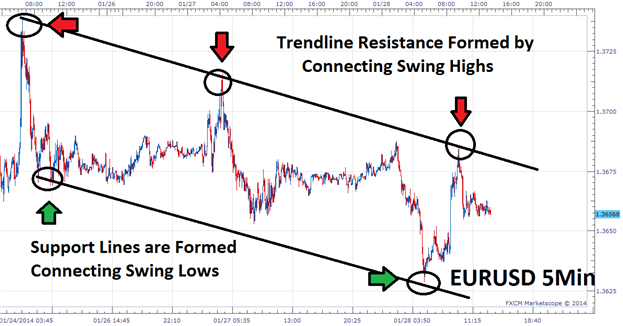
The first way of finding support and resistance is by using price action. Scalpers should become comfortable with finding swing highs and swing lows on their charts as they are natural areas of support and resistance. A swing high is identified as a peak on the graph and a swing low can be pinpointed as a valley. These extremes in price can help us prepare for either a swing or breakout trading opportunity depending on what the graph is displaying.
Above we can see today’s price action on a EURUSD 5minute chart. A price channel has been drawn by connecting a series of swing highs and swing lows. The swing highs help denote resistance and areas where scalpers may look for opportunities to sell. By connecting the swing lows, we have created an area of support where traders may wish to close existing sell positions, and potentially look for opportunities to buy.

Pivot Points
Pivot points also make great areas of support and resistance. These lines are drawn using a preset formula and are often favored by scalpers because they can be added to virtually any chart. Above is a great example of support in action on a EURGBP 30 minute chart using Camarilla Pivot Points. Once added, you can clearly see levels of support denoted by an “S” whereas lines of resistance are marked by an “R”. It should be noted that there are a variety of pivot points to choose from. Regardless of the pivots you use, their key purpose is to find these support and resistance levels for you. With that in mind, let’s look at an example.
Looking at today’s price movement on the EURGBP, we can clearly see price remained supported at the S3 camarilla pivot point. Traders looking to purchase the pair can wait for price to bounce off this value before looking to buy towards higher highs. It should be noted that resistance lines can also be used to find areas to sell as long as price remains in the trading range. In the event that price breaks the final levels of support or resistance, this would be identified as a market breakout. Knowing this, scalpers can adapt their pivot trading strategy to any market environment.

Moving Averages
Last we will take a look at using simple moving averages (MVA) as a level of support and resistance. Most traders may be familiar with this average on longer period graphs, but is just as effective on shorter time frames such as the 30 minute and 5 minute charts. If price is above the average, traders can wait for dips and look to buy a currency pair. Conversely if price breaks below this value, the 200 moving average will change from an area of support to new resistance. Traders can then look for selling opportunities as long as price remains under the indicator.
Above we have a 200 period MVA displayed on an AUDUSD 5 minute chart. For the majority of trading on January 27th price stayed above the displayed 200 MVA. Traders could have used this as an opportunity to buy retracements or look to trade breaks towards higher highs on the AUDUSD. This morning however, support was broken with price moving through the 200 MVA. At this point, traders should consider the average as resistance while potentially changing their trading bias.


")
![[XAUUSD]: Weekly Liquidity Activation Points (timings), June 29 - July 3, 2026](https://c.mql5.com/6/1014/splash-preview-772062.png "[XAUUSD]: Weekly Liquidity Activation Points (timings), June 29 - July 3, 2026")