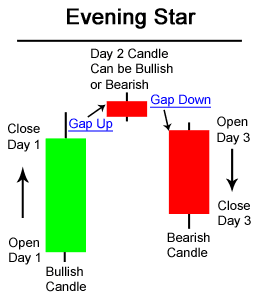
The Evening Star candlestick pattern is a powerful bearish candlestick reversal pattern.
- Large Bullish Candle (Day 1)
- Small Bullish or Bearish Candle (Day 2)
- Large Bearish Candle (Day 3)

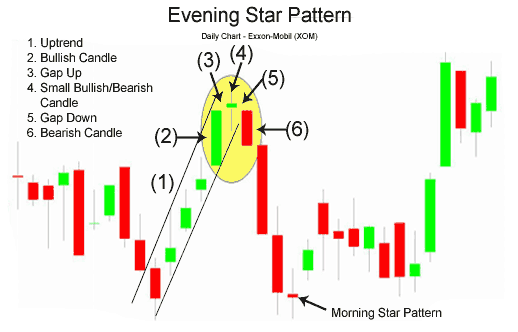
Evening Star Candlestick Chart Example

Day 1 of the Evening Star pattern for Exxon-Mobil (XOM) stock above was a strong bullish candle, in fact it was so strong that the close was the same as the high (very bullish sign). Day 2 continued Day 1's bullish sentiment by gapping up. However, Day 2 was a Doji, which is a candlestick signifying indecision. Bulls were unable to continue the large rally of the previous day; they were only able to close slightly higher than the open.
Day 3 began with a bearish gap down. In fact, bears took hold of Exxon-Mobil stock the entire day, the open was the same as the high and the close was the same as the low (a sign of very bearish sentiment). Also, Day 3 powerfully broke below the upward trendline that had served as support for XOM for the past week. Both the trendline break and the classic Evening Star pattern gave traders a signal to sell short Exxon-Mobil stock.
The Evening Star pattern is a very powerful three candlestick bearish reversal pattern. The bullish equivalent of the Evening Star is the Morning Star pattern


