
Technical Analysis for US Dollar, S&P 500, Gold and Crude Oil - Crude Oil Locked in Range Above $47, Gold Stuck Below $1300

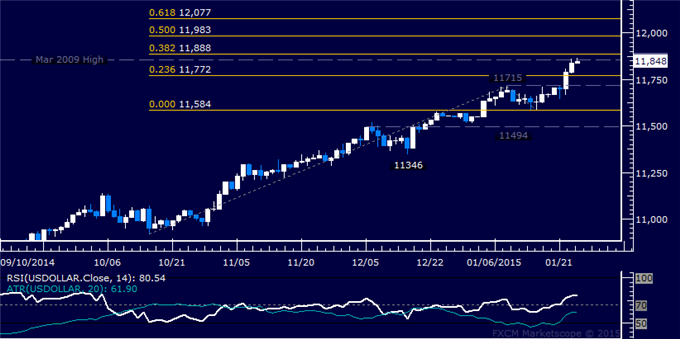
Prices are testing pivotal resistance marked by a peak dating back to March 2009. This barrier is reinforced by the 38.2% Fibonacci expansion at 11888, with a break below that on a daily closing basis exposing the 50% level at 11983.
S&P 500 TECHNICAL ANALYSIS
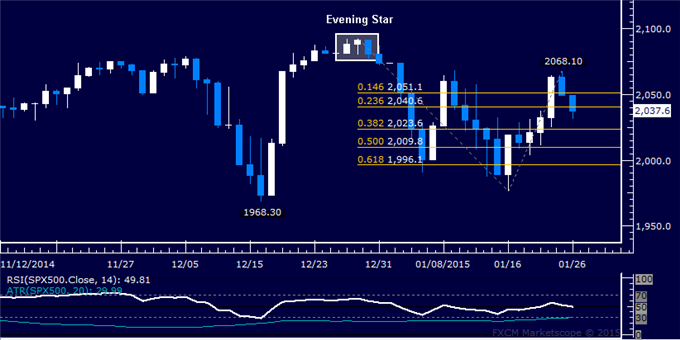
Prices declined as expected
after putting in a bearish Evening Star candlestick pattern. A daily
close below the 23.6% Fibonacci expansion at 2040.60 exposes the 38.2%
level at 2023.60.
GOLD TECHNICAL ANALYSIS
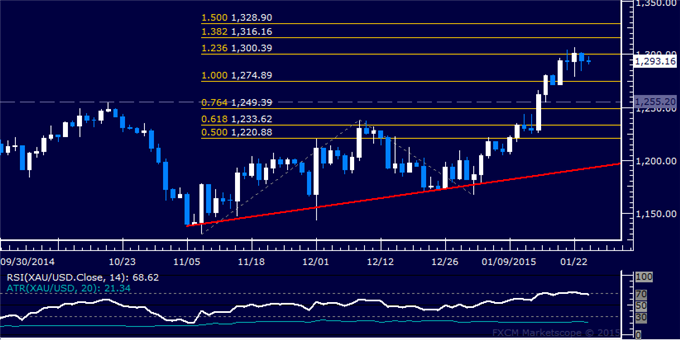
Prices continue to tread water near the
$1300/oz figure. A daily close above the 123.6% Fibonacci expansion at
1300.39 exposes the 138.2% level at 1316.16. Alternatively, a turn back
below the 100% Fib at 1274.89 targets the 1249.39-55.20 area marked by
the 76.4% expansion and the October 21 high.
CRUDE OIL TECHNICAL ANALYSIS
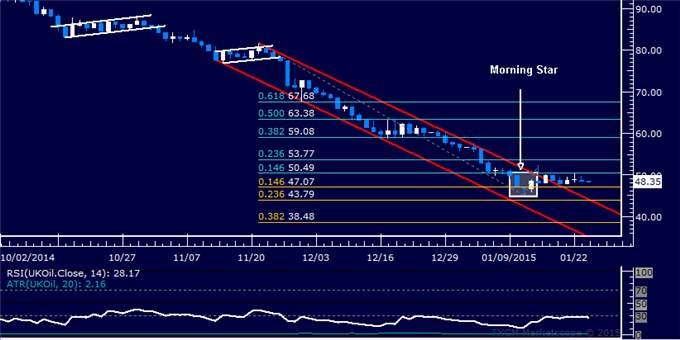
Prices are stalling having
attempted to recover as expected. A daily close above the 14.6%
Fibonacci retracement at 50.49 exposes the 23.6% level at 53.77.
Alternatively, a reversal below the 14.6% Fib expansion at 47.07 targets
the 23.6% threshold at 43.79.


 & AMD Framework")
")