
VIDEO LESSON - Introduction to the Double Top and Double Bottom Charting Pattern
27 November 2014, 15:11

0
3 206
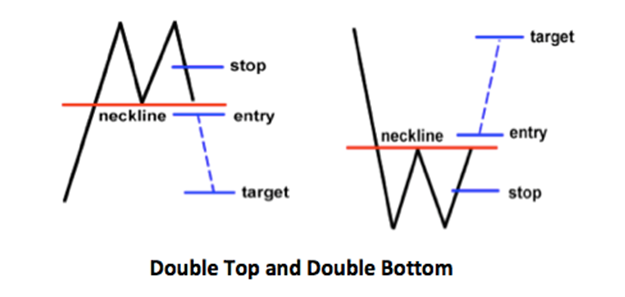
A double top is a reversal chart pattern which is defined by a chart
where a financial instrument makes a run up to a particular level, then
drops back from that level, then makes a second run at that level, and
then finally drops back off again.
In its most basic sense what the double top pattern is saying about supply and demand forces is that demand is out pacing supply (buyers are winning) up to the first top causing prices to rise, and then the equation flips and demand is no longer out pacing supply (sellers are winning) causing prices to fall. After then falling back the buyers make another run at the same price and then after failing to break that level for a second time, sellers take control and keep the upper hand causing prices to sell of even more dramatically after the second top than they did after the first. For double bottoms the reverse is true.
A double bottom is also a reversal pattern in the futures, forex, or stock markets which is the exact opposite of a double top. To form a double bottom a financial instrument makes a run down to a particular level, then trades up from that level then makes a second run down to at or near the same level as the first bottom, and then finally trades back up again.


