
Selection and navigation utility in MQL5 and MQL4: Adding data to charts
Introduction
We have already done quite a lot in the previous articles (Selection and navigation utility in MQL5 and MQL4: Adding auto search for patterns and displaying detected symbols, Selection and navigation utility in MQL5 and MQL4: Adding "homework" tabs and saving graphical objects, Developing the symbol selection and navigation utility in MQL5 and MQL4). But this is still not enough for high-quality intraday trading. In this article, we will add the new functionality allowing us to find suitable market entry/exit points.
Each functionality item will be described in a separate section. First, we will consider its objective. Then we will analyze a function or a code in case you want to implement the same functionality in your projects.
Hide symbols whose today's trend is different from the yesterday's one
Input: Hide if today's trend != yesterday
Area: Sorting settings
Many intraday trading gurus recommend trading stocks with their today's trend being the same as yesterday's one. Simply put, if the stock price rose yesterday, then it should rise today as well meaning you should trade only Long this day and vice versa.
The following function allows you to sort such symbols:
/*
Return true if today's trend is not equal to yesterday's one
symname - used symbol name
*/
bool check_no_trend(string symname){
   MqlRates rates2[];
   ArraySetAsSeries(rates2, true);
   if(CopyRates(symname, PERIOD_D1, 0, 2, rates2)==2){
      if( rates2[0].close>rates2[0].open && rates2[1].close>rates2[1].open ){
         return false;
      }
      if( rates2[0].close<rates2[0].open && rates2[1].close<rates2[1].open ){
         return false;
      }
   }
   return true;
}
Display session start
Input: Display the start of a day (on <D1 periods)
Area: Chart settings
Start of a trading session is a time when stock markets open (if we are talking about stocks), for example, 4:30 p.m. for the American stock market, and 10:00 a.m. for the European and Russian ones. In case of Forex, let's regard midnight as a start of a trading session.
On lower timeframes, like M5, it may be difficult to define the start of the current session, for example, in order to see at a glance whether a stock is growing or falling today. So we will add a setting allowing us to see a bar the current trading day on a symbol has begun from.
The function for displaying a session start:
/*
Displays a start of a day on a chart
currChart - chart id
day - day number (0 - current)
*/
void showNdays(long currChart, int day){
   MqlRates rates[];
   ArraySetAsSeries(rates, true);
   if(CopyRates(ChartSymbol(currChart), PERIOD_D1, day, 1, rates)>0){
      ObjectCreate(currChart, exprefix+"_Nday", OBJ_VLINE, 0, rates[0].time, 0);
      ObjectSetInteger(currChart,exprefix+"_Nday",OBJPROP_STYLE,STYLE_DOT);
      ObjectSetInteger(currChart,exprefix+"_Nday",OBJPROP_RAY,true);
      ObjectSetInteger(currChart,exprefix+"_Nday",OBJPROP_SELECTABLE,false);
      ObjectSetInteger(currChart,exprefix+"_Nday",OBJPROP_BACK,true);
   }
}
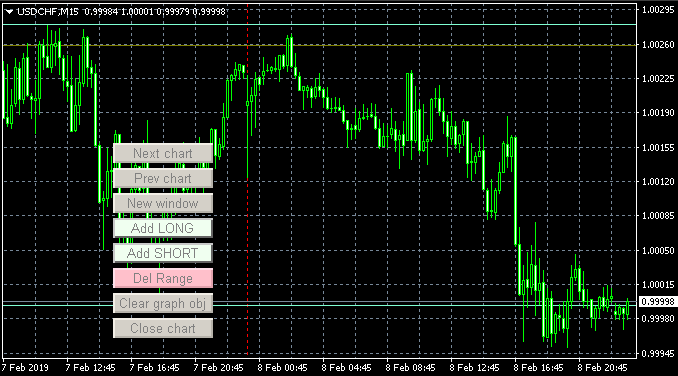
On the chart, this looks like a vertical red line:
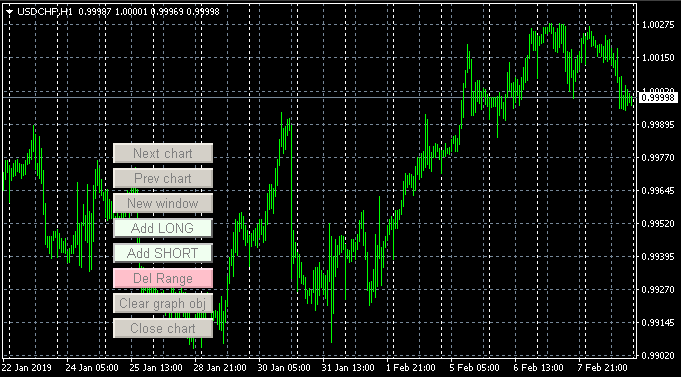
The similar functionality already exists in MetaTrader. Moreover, you can see not only the beginning of the last session, but the beginning of each session in general. To do this, check the "Show period separators" box in the chart properties. In real practice and on certain timeframes, this functionality is redundant and makes the chart cluttered and uncomfortable for analysis. For example:
Display yesterday's and the day before yesterday's Lows and Highs
Input: Display yesterday's low and high and Display the day before yesterday's low and high
Area: Chart settings
When trading intraday, yesterday's and the day before yesterday's Highs and Lows are often used as support and resistance levels. The price often falls, hits the yesterday's or the day before yesterday's High and rebounds. According to my experience, in 70% of cases, the price does not break such Highs/Lows.
Therefore, these levels should not be neglected.
The following function is used to display Low and High of a selected day:
/*
Display the specified day's Low and High on the chart
currChart - chart's id
day - displayed day index
*/
void showHOBeforeDay(long currChart, int day=1){
   MqlRates rates[];
   ArraySetAsSeries(rates, true);

   color curColor=clrAquamarine;
   switch(day){
      case 2:
         curColor=clrOlive;
         break;
   }

   if(CopyRates(ChartSymbol(currChart), PERIOD_D1, day, 1, rates)>0){
      ObjectCreate(currChart, exprefix+"_beforeday_high_line"+(string) day, OBJ_HLINE, 0, 0, rates[0].high);
      ObjectSetInteger(currChart,exprefix+"_beforeday_high_line"+(string) day,OBJPROP_COLOR,curColor);
      ObjectSetInteger(currChart,exprefix+"_beforeday_high_line"+(string) day,OBJPROP_SELECTABLE,false);
      ObjectSetInteger(currChart,exprefix+"_beforeday_high_line"+(string) day,OBJPROP_BACK,true);

      ObjectCreate(currChart, exprefix+"_beforeday_low_line"+(string) day, OBJ_HLINE, 0, 0, rates[0].low);
      ObjectSetInteger(currChart,exprefix+"_beforeday_low_line"+(string) day,OBJPROP_COLOR,curColor);
      ObjectSetInteger(currChart,exprefix+"_beforeday_low_line"+(string) day,OBJPROP_SELECTABLE,false);
      ObjectSetInteger(currChart,exprefix+"_beforeday_low_line"+(string) day,OBJPROP_BACK,true);
   }
}
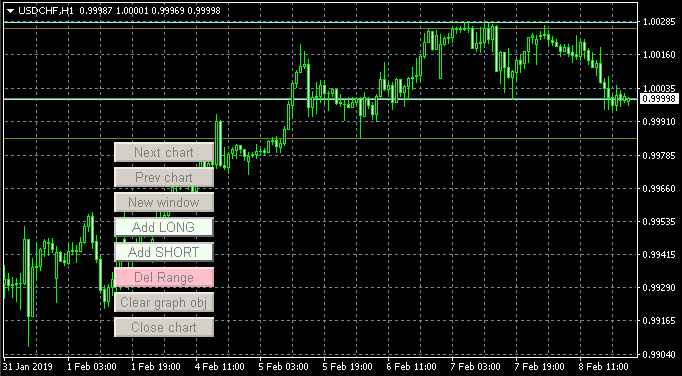
Yesterday's Low and High are displayed as bright horizontal lines, while the day before yesterday's ones are displayed as moss green lines:
Display the nearest round prices
Input: Display the nearest round prices (period < 1 day)
Area: Chart settings
Round prices are yet another natural support/resistance levels. These are the prices that end in .00 or .50. Many traders seek trading opportunities only near the round levels.
.25 and .75. levels may also be considered round but they are less reliable, therefore we will not track them not to clutter the chart.
The following function is used to display round prices:
/*
Display three nearest round levels for the current price.
currChart - chart id
*/
void showRoundPrice(long currChart){
   string name=ChartSymbol(currChart);
   int tmpPrice;

   MqlRates rates[];
   ArraySetAsSeries(rates, true);
   if(CopyRates(name, PERIOD_D1, 0, 1, rates)==1){
      switch((int) SymbolInfoInteger(name, SYMBOL_DIGITS)){
         case 0:
            break;
         case 2:
         case 3:
         case 5:
            tmpPrice=(int) rates[0].close;

            ObjectCreate(currChart, exprefix+"_round_line_00_0", OBJ_HLINE, 0, 0, (double) tmpPrice-1 );
            ObjectSetInteger(currChart,exprefix+"_round_line_00_0",OBJPROP_COLOR,clrCadetBlue);
            ObjectSetInteger(currChart,exprefix+"_round_line_00_0",OBJPROP_STYLE, STYLE_DASH);
            ObjectSetInteger(currChart,exprefix+"_round_line_00_0",OBJPROP_SELECTABLE,false);
            ObjectSetInteger(currChart,exprefix+"_round_line_00_0",OBJPROP_BACK,true);

            ObjectCreate(currChart, exprefix+"_round_line_05_0", OBJ_HLINE, 0, 0, (double) tmpPrice-0.5 );
            ObjectSetInteger(currChart,exprefix+"_round_line_05_0",OBJPROP_COLOR,clrCadetBlue);
            ObjectSetInteger(currChart,exprefix+"_round_line_05_0",OBJPROP_STYLE, STYLE_DASH);
            ObjectSetInteger(currChart,exprefix+"_round_line_05_0",OBJPROP_SELECTABLE,false);
            ObjectSetInteger(currChart,exprefix+"_round_line_05_0",OBJPROP_BACK,true);

            ObjectCreate(currChart, exprefix+"_round_line_00_1", OBJ_HLINE, 0, 0, (double) tmpPrice );
            ObjectSetInteger(currChart,exprefix+"_round_line_00_1",OBJPROP_COLOR,clrCadetBlue);
            ObjectSetInteger(currChart,exprefix+"_round_line_00_1",OBJPROP_STYLE, STYLE_DASH);
            ObjectSetInteger(currChart,exprefix+"_round_line_00_1",OBJPROP_SELECTABLE,false);
            ObjectSetInteger(currChart,exprefix+"_round_line_00_1",OBJPROP_BACK,true);

            ObjectCreate(currChart, exprefix+"_round_line_05_1", OBJ_HLINE, 0, 0, (double) tmpPrice+0.5 );
            ObjectSetInteger(currChart,exprefix+"_round_line_05_1",OBJPROP_COLOR,clrCadetBlue);
            ObjectSetInteger(currChart,exprefix+"_round_line_05_1",OBJPROP_STYLE, STYLE_DASH);
            ObjectSetInteger(currChart,exprefix+"_round_line_05_1",OBJPROP_SELECTABLE,false);
            ObjectSetInteger(currChart,exprefix+"_round_line_05_1",OBJPROP_BACK,true);

            ObjectCreate(currChart, exprefix+"_round_line_00_2", OBJ_HLINE, 0, 0, (double) tmpPrice+1 );
            ObjectSetInteger(currChart,exprefix+"_round_line_00_2",OBJPROP_COLOR,clrCadetBlue);
            ObjectSetInteger(currChart,exprefix+"_round_line_00_2",OBJPROP_STYLE, STYLE_DASH);
            ObjectSetInteger(currChart,exprefix+"_round_line_00_2",OBJPROP_SELECTABLE,false);
            ObjectSetInteger(currChart,exprefix+"_round_line_00_2",OBJPROP_BACK,true);

            ObjectCreate(currChart, exprefix+"_round_line_05_2", OBJ_HLINE, 0, 0, (double) tmpPrice+1.5 );
            ObjectSetInteger(currChart,exprefix+"_round_line_05_2",OBJPROP_COLOR,clrCadetBlue);
            ObjectSetInteger(currChart,exprefix+"_round_line_05_2",OBJPROP_STYLE, STYLE_DASH);
            ObjectSetInteger(currChart,exprefix+"_round_line_05_2",OBJPROP_SELECTABLE,false);
            ObjectSetInteger(currChart,exprefix+"_round_line_05_2",OBJPROP_BACK,true);

            break;
      }
   }
}
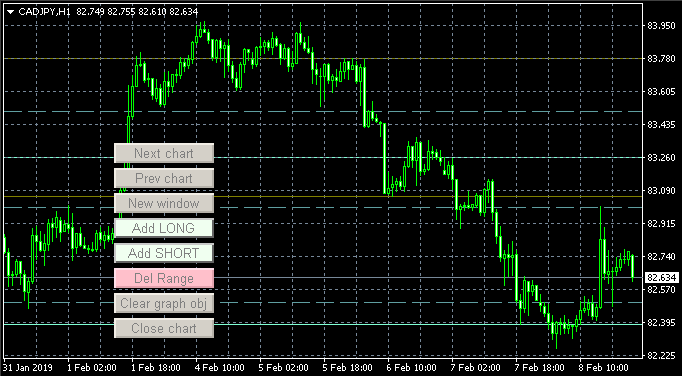
On the chart, round levels are shown with dashed horizontal lines:
Display hour closing
Input parameter: Display hour closing (period < 1hour)
Area: Chart settings
Continuing the subject of natural support/resistance levels, we can also mention hour closing levels. It is believed that the hour closing price can also be a support/resistance level on smaller timeframes, although I have never noticed that in real trading. Nevertheless, let's implement the ability to display this parameter at least for the last four hours.
The function for highlighting hour closing on the chart:
/*
Display closing the last four hours on the chart
currChart - chart id
*/
void showCloseHour(long currChart){
   MqlDateTime tmpTime;
   int tmpOffset=0;
   MqlRates rates[];
   ArraySetAsSeries(rates, true);
   if(CopyRates(ChartSymbol(currChart), PERIOD_M30, 0, 9, rates)>0){
      tmpOffset=0;
      TimeToStruct(rates[tmpOffset].time, tmpTime);
      if(tmpTime.min!=0){
         tmpOffset++;
      }
      ObjectCreate(currChart, exprefix+"_hour_0", OBJ_VLINE, 0, rates[tmpOffset].time, 0);
      ObjectSetInteger(currChart,exprefix+"_hour_0",OBJPROP_SELECTABLE,false);
      ObjectSetInteger(currChart,exprefix+"_hour_0",OBJPROP_STYLE,STYLE_DOT);
      ObjectSetInteger(currChart,exprefix+"_hour_0",OBJPROP_RAY,true);
      ObjectSetInteger(currChart,exprefix+"_hour_0",OBJPROP_COLOR,clrYellow);
      ObjectSetInteger(currChart,exprefix+"_hour_0",OBJPROP_BACK,true);

      tmpOffset++;
      TimeToStruct(rates[tmpOffset].time, tmpTime);
      if(tmpTime.min!=0){
         tmpOffset++;
      }
      ObjectCreate(currChart, exprefix+"_hour_1", OBJ_VLINE, 0, rates[tmpOffset].time, 0);
      ObjectSetInteger(currChart,exprefix+"_hour_1",OBJPROP_SELECTABLE,false);
      ObjectSetInteger(currChart,exprefix+"_hour_1",OBJPROP_STYLE,STYLE_DOT);
      ObjectSetInteger(currChart,exprefix+"_hour_1",OBJPROP_RAY,true);
      ObjectSetInteger(currChart,exprefix+"_hour_1",OBJPROP_COLOR,clrYellow);
      ObjectSetInteger(currChart,exprefix+"_hour_1",OBJPROP_BACK,true);

      tmpOffset++;
      TimeToStruct(rates[tmpOffset].time, tmpTime);
      if(tmpTime.min!=0){
         tmpOffset++;
      }
      ObjectCreate(currChart, exprefix+"_hour_2", OBJ_VLINE, 0, rates[tmpOffset].time, 0);
      ObjectSetInteger(currChart,exprefix+"_hour_2",OBJPROP_SELECTABLE,false);
      ObjectSetInteger(currChart,exprefix+"_hour_2",OBJPROP_STYLE,STYLE_DOT);
      ObjectSetInteger(currChart,exprefix+"_hour_2",OBJPROP_RAY,true);
      ObjectSetInteger(currChart,exprefix+"_hour_2",OBJPROP_COLOR,clrYellow);
      ObjectSetInteger(currChart,exprefix+"_hour_2",OBJPROP_BACK,true);

      tmpOffset++;
      TimeToStruct(rates[tmpOffset].time, tmpTime);
      if(tmpTime.min!=0){
         tmpOffset++;
      }
      ObjectCreate(currChart, exprefix+"_hour_3", OBJ_VLINE, 0, rates[tmpOffset].time, 0);
      ObjectSetInteger(currChart,exprefix+"_hour_3",OBJPROP_SELECTABLE,false);
      ObjectSetInteger(currChart,exprefix+"_hour_3",OBJPROP_STYLE,STYLE_DOT);
      ObjectSetInteger(currChart,exprefix+"_hour_3",OBJPROP_RAY,true);
      ObjectSetInteger(currChart,exprefix+"_hour_3",OBJPROP_COLOR,clrYellow);
      ObjectSetInteger(currChart,exprefix+"_hour_3",OBJPROP_BACK,true);

   }
}
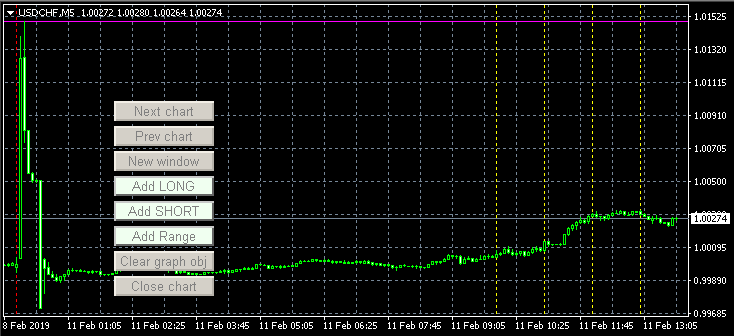
On the chart, the closure of the last four hours is displayed as vertical yellow lines:
Display the maximum and minimum price for a year
Input: Display max/min price for a year
Area: Chart settings
Maximum and minimum prices for a year are also quite popular among traders. Display them on the chart as well.
The following function is used to display extreme prices within a year:
/*
Display the maximum and minimum price for the last year on the chart.
currChart - chart id.
*/
void showMaxPrice(long currChart){
   MqlRates rates[];
   ArraySetAsSeries(rates, true);
   if(CopyRates(ChartSymbol(currChart), PERIOD_MN1, 0, 12, rates)==12){
      double maxPrice=0;
      double minPrice=0;


      for(int j=0; j<12; j++){
         if( maxPrice==0 || maxPrice<rates[j].high ){
            maxPrice=rates[j].high;
         }
         if( minPrice==0 || minPrice>rates[j].low ){
            minPrice=rates[j].low;
         }
      }

      ObjectCreate(currChart, exprefix+"_maxprice_line", OBJ_HLINE, 0, 0, maxPrice);
      ObjectSetInteger(currChart,exprefix+"_maxprice_line",OBJPROP_COLOR,clrMagenta);
      ObjectSetInteger(currChart,exprefix+"_maxprice_line",OBJPROP_SELECTABLE,false);
      ObjectSetInteger(currChart,exprefix+"_maxprice_line",OBJPROP_BACK,true);

      ObjectCreate(currChart, exprefix+"_minprice_line", OBJ_HLINE, 0, 0, minPrice);
      ObjectSetInteger(currChart,exprefix+"_minprice_line",OBJPROP_COLOR,clrMagenta);
      ObjectSetInteger(currChart,exprefix+"_minprice_line",OBJPROP_SELECTABLE,false);
      ObjectSetInteger(currChart,exprefix+"_minprice_line",OBJPROP_BACK,true);


   }
}
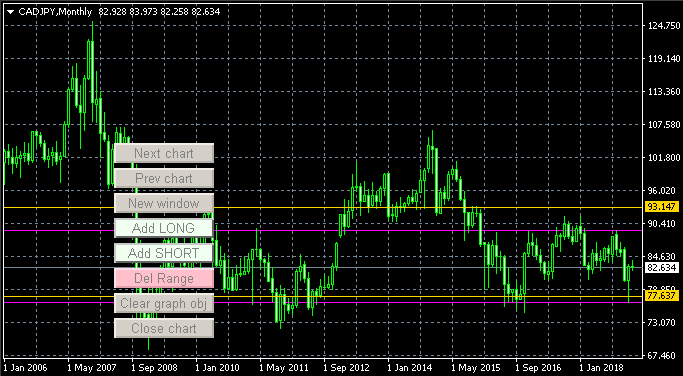
The maximum and minimum prices for the last 12 months are displayed as purple horizontal lines:
Display the spread when opening a chart
Input: Display the spread when opening a chart
Area: Chart settings
If you use small stop losses, the current symbol spread is one of the decisive factors for entering a trade. Therefore, it is important to know it at the time of opening a chart. So, let's add more data to our charts.
Keep in mind that we display the spread only at the moment a chart was opened. It may change in a matter of moments. The spread level is not displayed in real time. It is only used to evaluate the current spread range on a symbol.
The following small function returns the spread:
/*
Return the string with the current spread for a specified symbol.
symname - symbol name
*/
string getmespread_symbol(string symname){
   double curSpread=SymbolInfoDouble(symname, SYMBOL_ASK)-SymbolInfoDouble(symname, SYMBOL_BID);
   return "Spread: "+(string) DoubleToString(curSpread, (int) SymbolInfoInteger(symname, SYMBOL_DIGITS))+" "+SymbolInfoString(symname, SYMBOL_CURRENCY_PROFIT)+" ("+DoubleToString(curSpread/SymbolInfoDouble(symname, SYMBOL_POINT), 0)+" p)";
}
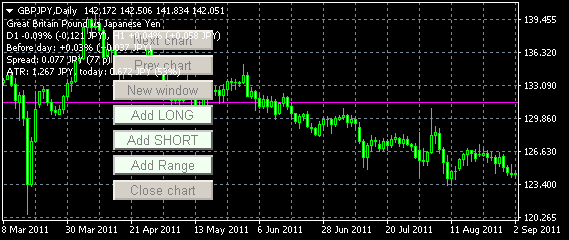
The spread is displayed in comments to an open chart among other additional data:
Apply a template with a name to a chart
Input: Apply a template with a name to a chart
Area: Chart settings
In MetaTrader, templates are used to quickly apply preferred settings, EAs and, more importantly, indicators with preferred parameters to a chart.
However, "quickly" is a loose concept. To apply a template to a chart, select Templates/"Template name" in the chart's context menu. But what if an indicator, for example, Moving Average, is important for you in making a decision, and you want to see it on every chart you open, while working with hundreds of instruments per day. Do you really have to click on each of them?
It would be much easier to automatically apply a specific template with a set of indicators to each opened chart. So let's implement this feature.
To apply a template to the chart, use the ChartApplyTemplate command that works both in MQL5 and MQL4:
ChartApplyTemplate(curChartID[ArraySize(curChartID)-1], allApplyTemplate+".tpl");
Display Gerchik's ATR
Input: Display Gerchik's ATR
Area: Chart settings
ATR, which is an average daily symbol movement within a certain period, is an important parameter when determining the symbol's action range. It is used for different purposes.
For example, it helps to decide on whether it is worth entering in a trade during intraday trading. If you want to capture a 100-point movement, while the symbol's average range within a day is 50 points, your chances are small and it is better not to enter in a trade.
It is also considered that if a symbol has already passed more than 80% of its daily ATR in one direction, then it makes no sense to make deals in the same direction, and you can work only in the opposite direction.
Gerchik's ATR is different from conventional ATR in that only abnormal bars are taken into account. Abnormal bars are the ones that are 2 times bigger or 0.3 smaller than the average ones.
ATR is usually calculated for 5 or 3 days.
The following function displays Gerchik's ATR:
/*
Return the string with Gerchik's ATR for a specified symbol:
symname - symbol name
*/
string getmeatr_symbol(string symname){
   string msg="";
   MqlRates rates[];
   ArraySetAsSeries(rates, true);
   double atr=0;
   double pre_atr=0;
   int curDigits=(int) SymbolInfoInteger(symname, SYMBOL_DIGITS);
   string currencyS=SymbolInfoString(symname, SYMBOL_CURRENCY_PROFIT);
   int count=0;
   int copied=CopyRates(symname, PERIOD_D1, 0, 8, rates);
   if(copied>1){
      for(int j=1; j<copied; j++){
         pre_atr+=rates[j].high-rates[j].low;
      }
      pre_atr/=(copied-1);
   }
   if(pre_atr>0){
      for(int j=1; j<copied; j++){
         if( rates[j].high-rates[j].low > pre_atr*2 ) continue;
         if( rates[j].high-rates[j].low < pre_atr*0.3 ) continue;

         if( ++count > 5 ){
            break;
         }

         atr+=rates[j].high-rates[j].low;
      }
      if( count > 5 ){
         count=5;
      }
      atr= NormalizeDouble(atr/count, curDigits );
   }
   if(atr>0){
      StringAdd(msg, "ATR: "+(string) DoubleToString(atr, curDigits)+" "+currencyS+", today: "+DoubleToString(rates[0].high-rates[0].low, curDigits)+" "+currencyS+" ("+(string) (int) (((rates[0].high-rates[0].low)/atr)*100) +"%)");
   }

   return msg;
}
The utility displays ATR in a chart comment, like the spread described in the previous section. ATR can be seen in the previous screenshot.
Display directions for guiding symbols
Input: Display direction on #N
Area: Display additional data
Judging from what I have already mentioned in this article, intraday trading is a very complicated endeavor as there are many things to track and keep in mind. And as it turns out, this is not all.
Many traders recommend looking at the current direction on so-called guiding symbols before entering into a trade.
For example, if you trade in the US stock market, then you need to follow:
- the major US indices, at least Dow Jones or SP500;
- one index of the remaining countries: China, Europe, Japan;
- large cap companies in various market segments: JPMorgan in the banking sector, Apple in technology, ExxonMobil in energy, IBM and some others.
You can also track oil, gold and USD quotes.
It is best if all guiding symbols go in one direction. As you probably guessed, it is better to trade only in the direction, in which the guiding symbols go.
Since different brokers may have different names for the same instrument, it is impossible to programmatically specify the instruments to be monitored. But we can add the incoming parameters of the string type allowing users to set the tickers of the symbols as they are named by their brokers. The utility features seven parameters for that.
The following function returns the direction on a specified symbol:
/*
Return the string with the price movement direction by a specified symbol:
symname - symbol name
show - if a symbol name label should be displayed in the string
*/
string getmeinfo_symbol(string symname, bool show=true){
   MqlRates rates2[];
   ArraySetAsSeries(rates2, true);
   string msg="";

   if(CopyRates(symname, PERIOD_D1, 0, 1, rates2)>0){
      if(show){
         StringAdd(msg, (string) symname+": ");
      }
      StringAdd(msg, "D1 ");
      if( rates2[0].close > rates2[0].open ){
         StringAdd(msg, "+"+DoubleToString(((rates2[0].close-rates2[0].open)/rates2[0].close)*100, 2) +"% (+"+DoubleToString(rates2[0].close-rates2[0].open, (int) SymbolInfoInteger(symname, SYMBOL_DIGITS))+" "+SymbolInfoString(symname, SYMBOL_CURRENCY_PROFIT)+")");
      }else{
         if( rates2[0].close < rates2[0].open ){
            StringAdd(msg, "-"+DoubleToString(((rates2[0].open-rates2[0].close)/rates2[0].close)*100, 2) +"% (-"+DoubleToString(rates2[0].open-rates2[0].close, (int) SymbolInfoInteger(symname, SYMBOL_DIGITS))+" "+SymbolInfoString(symname, SYMBOL_CURRENCY_PROFIT)+")");
         }else{
            StringAdd(msg, "0%");
         }
      }
   }
   if(CopyRates(symname, PERIOD_H1, 0, 1, rates2)>0){
      StringAdd(msg, ", H1 ");
      if( rates2[0].close > rates2[0].open ){
         StringAdd(msg, "+"+DoubleToString(((rates2[0].close-rates2[0].open)/rates2[0].close)*100, 2)+"% (+"+DoubleToString(rates2[0].close-rates2[0].open, (int) SymbolInfoInteger(symname, SYMBOL_DIGITS))+" "+SymbolInfoString(symname, SYMBOL_CURRENCY_PROFIT)+")");
      }else{
         if( rates2[0].close < rates2[0].open ){
            StringAdd(msg, "-"+DoubleToString(((rates2[0].open-rates2[0].close)/rates2[0].close)*100, 2)+"% (-"+DoubleToString(rates2[0].open-rates2[0].close, (int) SymbolInfoInteger(symname, SYMBOL_DIGITS))+" "+SymbolInfoString(symname, SYMBOL_CURRENCY_PROFIT)+")");
         }else{
            StringAdd(msg, "0%");
         }
      }
   }

   return msg;
}
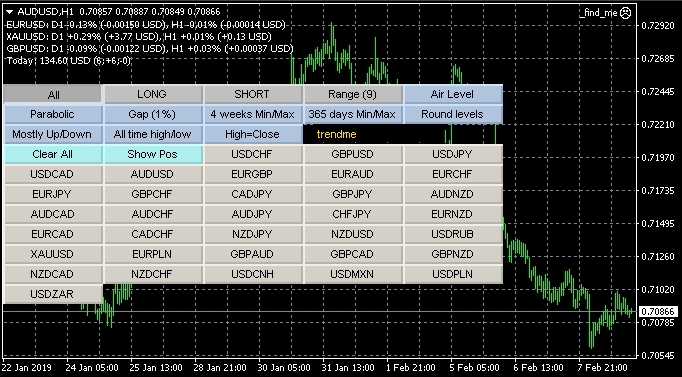
Directions are displayed in the chart comment the utility is launched at. This looks as follows.
Please note that movement direction of guiding symbols is not updated automatically. To update data on them, switch to any other tab or press R. However, this can also be simplified with a new input.
Auto update of utility tabs
Input: Update an open tab every set number of seconds
Area: Display additional data
If you want the contents of a currently opened tab to update automatically (and not just by pressing R), simply set the number of seconds, after which the update occurs. The value exceeding 0 prompts the utility to update the tab after the specified number of seconds passes. This does not mean that the tab will be updated strictly every N seconds. Instead, it means the tab will be updated approximately in N plus one-two more seconds.
The code implementing the functionality is located inside the OnTimer function and is very simple:
   // update the contents of the tab after a specified number of seconds
   if( autoUpdateAfter>0 && TimeCurrent()-lastUpd >= autoUpdateAfter ){
      start_symbols();
      lastUpd=TimeCurrent();
   }
At the start of the utility operation, we initialized the lastUpd variable value by the current time in the OnInit function.
Display financial data on stocks
Input: Display company info
Area: External data
If you follow the company's fundamental parameters before buying or selling its shares, you probably want these parameters to be displayed directly in the MetaTrader window in order not to browse through different websites.
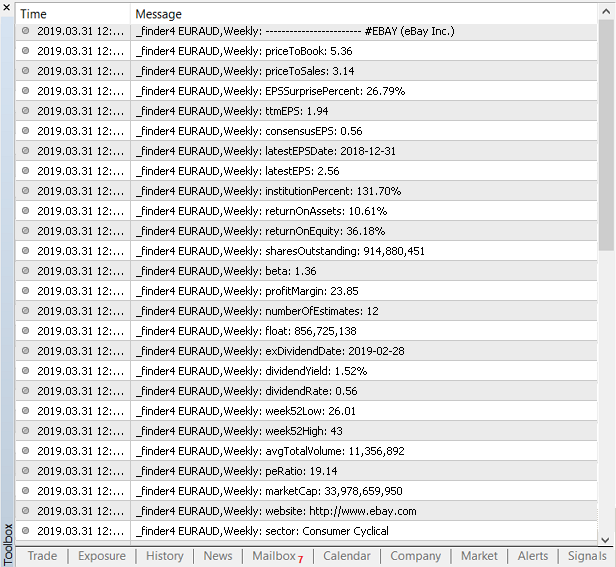
Let's try to implement that functionality. To make it simple, we will display the parameters in the terminal's Experts tab as soon as a chart is opened using the utility.
The financial parameters themselves are not pulled out of thin air, of course. At first, I wanted to “hardcode” them directly into the EA, but the insufficient memory error interfered with my plan. Therefore, all financial parameters are stored separately in the finder folder attached to the article. To make this functionality work, download the archive, unpack it and place the finder folder to the Files directory of your terminal.
To find the Files directory, open the File menu in MetaTrader and click Open Data Folder. In the newly opened Explorer window, move to MQL4 or MQL5 folder.
These financial parameters are relevant as of the day of writing this article and, possible, over the next few months. Write me a personal message if you need more relevant data later.
But let's get back to the data output function. The function removes redundant elements from the company's ticker, namely, the # prefix, as well as the .us and .eu suffixes added by some brokers. If your broker adds something else to the ticker, add your own filters to the utility code to remove the excessive characters.
If no necessary ticker data is found in the finder folder, the search is performed by a company name.
void printTicker(string ticker, string name){
   bool isYes=false;
   int filehandle;

   // remove redundant suffixes and prefixes from the ticker
   // and convert it to lower case
   StringToLower(ticker);
   StringReplace(ticker, "#", "");
   StringReplace(ticker, ".us", "");
   StringReplace(ticker, ".eu", "");

   // convert the company name to lower case
   StringToLower(name);

   ResetLastError();
   // if the 'finder' folder has data on the company, display it
   if( FileIsExist("finder\\"+ticker+".dat") ){
      isYes=true;
      filehandle=FileOpen("finder\\"+ticker+".dat",FILE_READ|FILE_TXT);
      if(filehandle!=INVALID_HANDLE){
         int str_size;
         string str;
         Print("----------------");
         while(!FileIsEnding(filehandle)){
            str_size=FileReadInteger(filehandle,INT_VALUE);
            str=FileReadString(filehandle,str_size);
            Print(str);
         }
         FileClose(filehandle);
      }
   }else if( FileIsExist("finder\\"+name+".dat") ){
      isYes=true;
      filehandle=FileOpen("finder\\"+name+".dat",FILE_READ|FILE_TXT);
      if(filehandle!=INVALID_HANDLE){
         int str_size;
         string str;
         Print("----------------");
         while(!FileIsEnding(filehandle)){
            str_size=FileReadInteger(filehandle,INT_VALUE);
            str=FileReadString(filehandle,str_size);
            Print(str);
        }
         FileClose(filehandle);
      }
   }

   // otherwise, inform that the data is not found
   if(!isYes){
      Print("No symbol data");
   }
}
As a result, when opening a chart using the utility, the company info is displayed in the Experts tab. This approximately looks as follows:
Display today's profit
Input: Display today's profit
Area: Display additional data
Finally, let's add the parameter allowing us to stop our day trading activity in due time, which is the amount of profit or loss received during a day, as well as the total number of deals per day with the numbers of profitable and loss-making ones (displayed on the chart in the mentioned sequence).
You can obtain the current profit for MQL4 using the getmetoday_profit() custom function shown below. In case of MQL5, this function is insufficient.
In MQL5, we first check if the data on closed positions should be updated. To do this, use the globally declared needHistory variable. In the OnInit() standard function, this variable gets the value of 'true'. Therefore, during the getmetoday_profit() function first launch, the data on deals is uploaded from history. After that, the value of the needHistory variable becomes equal to 'false'.
Next, we use the standard MQL5 OnTrade() function to upload the deal history again every time one of our open positions is closed.
As a result, we have the following code:
#ifdef __MQL5__
   void OnTrade(){
      if(orders_total==PositionsTotal()){
         return;
      }
      if(orders_total>PositionsTotal()){
         needHistory=true;
      }
      orders_total=(ushort) PositionsTotal();
   }
#endif
/*
Return the string with the today's profit/loss.
*/
string getmetoday_profit(){
   string msg="";
   double curProfit=0;
   int tradeAll=0;
   int tradeMinus=0;
   int tradePlus=0;

   MqlDateTime curD;
   TimeCurrent(curD);
   curD.hour=0;
   curD.min=0;
   curD.sec=0;

   #ifdef __MQL5__
      if( needHistory ){
         HistorySelect(StructToTime(curD),TimeCurrent());
      }
      uint totalHistory=HistoryDealsTotal();
      double currHistory=0;
      ulong ticket_history;
      for(uint j=0;j<totalHistory;j++){
         if((ticket_history=HistoryDealGetTicket(j))>0 ){
            double profitHistory=HistoryDealGetDouble(ticket_history,DEAL_PROFIT);
            profitHistory+=HistoryDealGetDouble(ticket_history,DEAL_COMMISSION);
            profitHistory+=HistoryDealGetDouble(ticket_history,DEAL_SWAP);
            if(profitHistory!=0){
               currHistory+=profitHistory;
            }
         }
      }

   #else
      int cntMyPos=OrdersHistoryTotal();
      if(cntMyPos>0){
         for(int ti=cntMyPos-1; ti>=0; ti--){
            if(OrderSelect(ti,SELECT_BY_POS,MODE_HISTORY)==false) continue;

            if( OrderCloseTime()<StructToTime(curD) ){ continue; }

            double tmpProfit=OrderProfit();
            tmpProfit+=OrderSwap();
            tmpProfit+=OrderCommission();

            tradeAll++;
            if(tmpProfit>0){
               tradePlus++;
            }else if(tmpProfit<0){
               tradeMinus++;
            }
            curProfit+=tmpProfit;
         }
      }
   #endif

   if(tradeAll>0){
      StringAdd(msg, "Today: "+DoubleToString(curProfit, 2)+" "+AccountInfoString(ACCOUNT_CURRENCY)+" ("+(string) tradeAll+";+"+(string) tradePlus+";-"+(string) tradeMinus+")");
   }

   return msg;
}
The profit is also displayed on the chart the utility is launched on. This looks as follows:
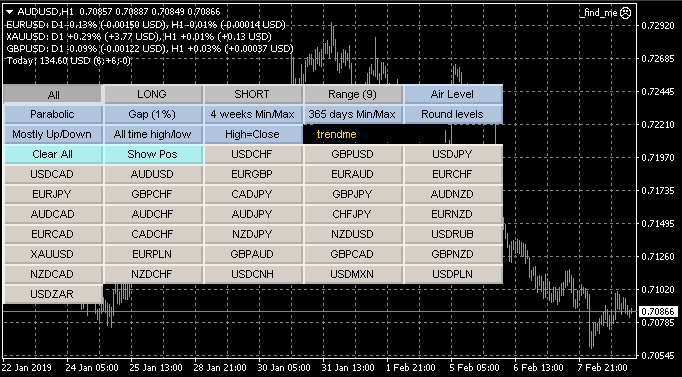
Keep in mind that the day's profit is not re-calculated automatically. To update the current profit data, open another tab or press R.
Conclusion
This is most probably the last article in the series. I hope, the resulting utility will be useful to you.
But if you lack some functionality, write me about it. I will continue improving the utility in case there are enough missing pieces of functionality to write a new article.
In conclusion, let's summarize and briefly review the functionality we have implemented during this series of articles.
After launching the utility, we gain access to a list of tools meeting our conditions. Above the list, we can see the buttons of All, LONG, SHORT and Range tabs, as well as auto sorting tabs. The All tab is opened by default:
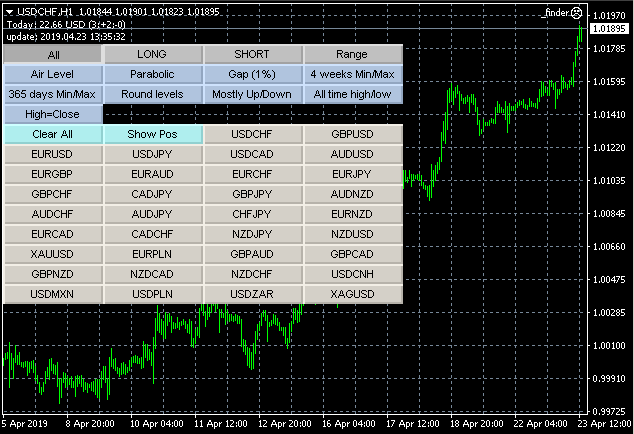
In the chart comment, you can see the line starting with update. This line contains the time of the last tab contents update. Press R to update the current tab manually. Besides, you can specify the currently open tab contents update periodicity (in seconds) in the utility settings.
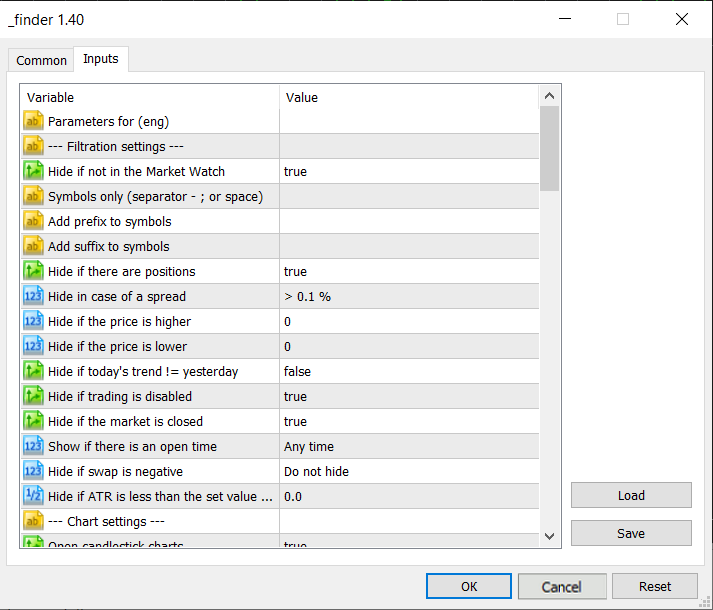
Speaking of the utility settings... It will be much easier to understand our utility's functionality if we consider these settings.
The list of symbols displayed in the All tab depends on the Filtration settings group:
If we click on a symbol button displayed by the utility, the appropriate symbol chart with extra data is opened:
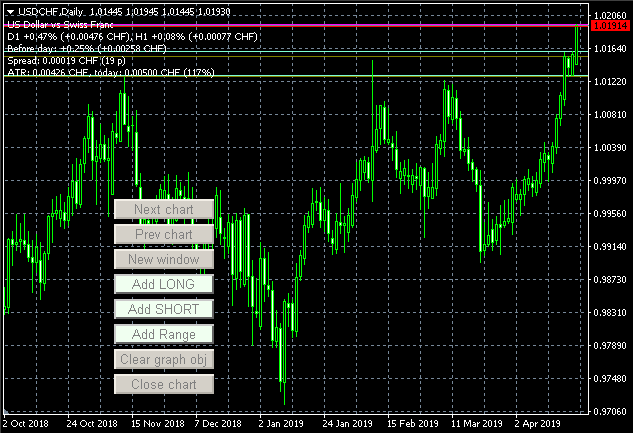
The first thing we can notice on the chart are navigation buttons. They allow us to move from one symbol sorted by the utility to another. Also, the buttons allow us to add symbols to the "homework" tabs (LONG, SHORT and Range) or remove them from there.
Also, the chart comment features a variety of symbol data. Besides, there are various horizontal lines.
The purple line indicates year's High/Low.
The red one stands for the custom level. The utility can save and restore all custom levels drawn for a symbol.
As already mentioned, the moss green line stands for the day before yesterday's Open/Close price. The last line on the screenshot means the yesterday's Open/Close price.
The Chart settings group defines what lines and data are to be displayed on a symbol chart:
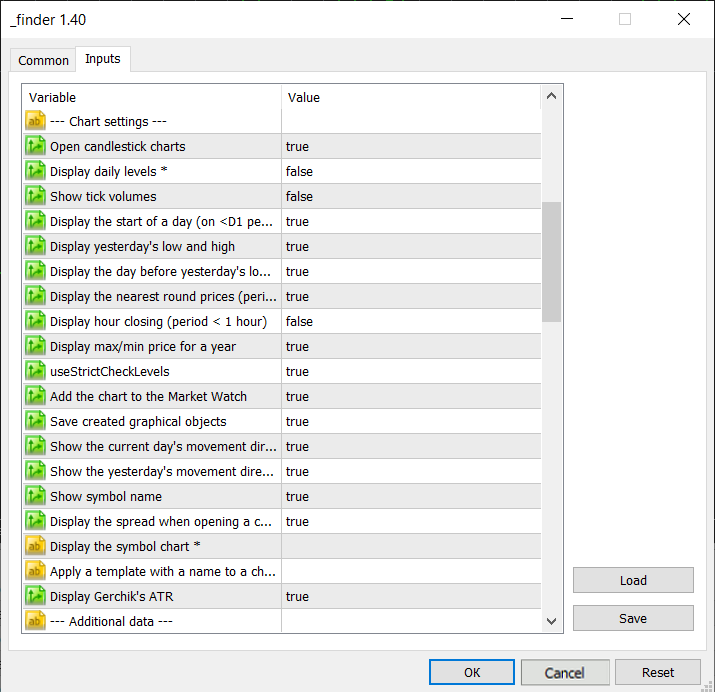
A timeframe and a chart display scale are also customizable. This is done separately for the All tab, "homework" tabs and some auto sorting tabs.
A timeframe for the All tab is set in the Additional data group:
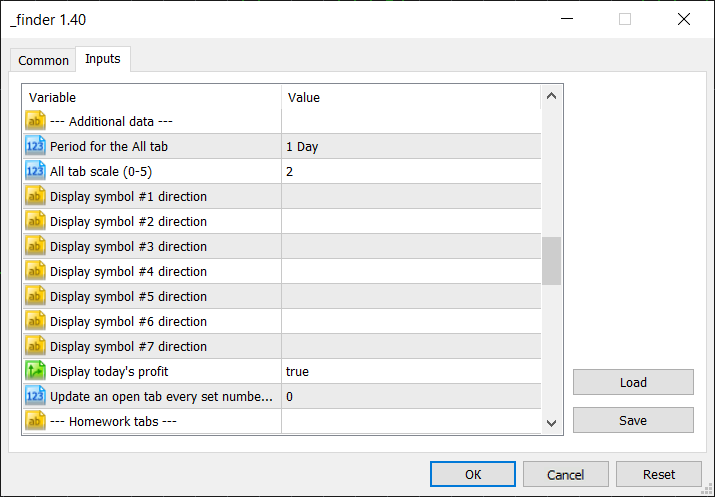
D1 is used by default for all symbol buttons on the All tab. Let's change it to M15:
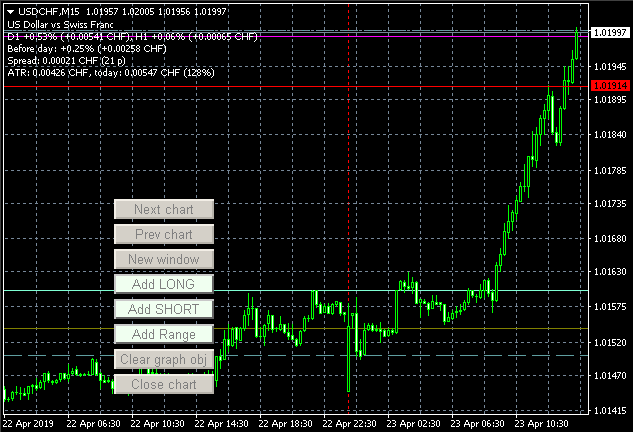
This allows us to see a few more lines on the chart the utility can display since these lines are displayed only on periods of less than 1 day.
The red vertical line shows the bar the current session starts at and makes it easy to visually determine if a symbol is rising or falling today.
The dashed horizontal line indicates round levels, i.e. the prices ending in .00 or .50 for quotes with 2 decimal places or in 0.x1000/0.xx500 for quotes with 4 and 5 decimal places (like here).
But let's get back to the settings. The auto sorting tabs also have their own settings. The global ones are located in the Additional tabs groups. Also, there are separate groups with settings for some tabs:
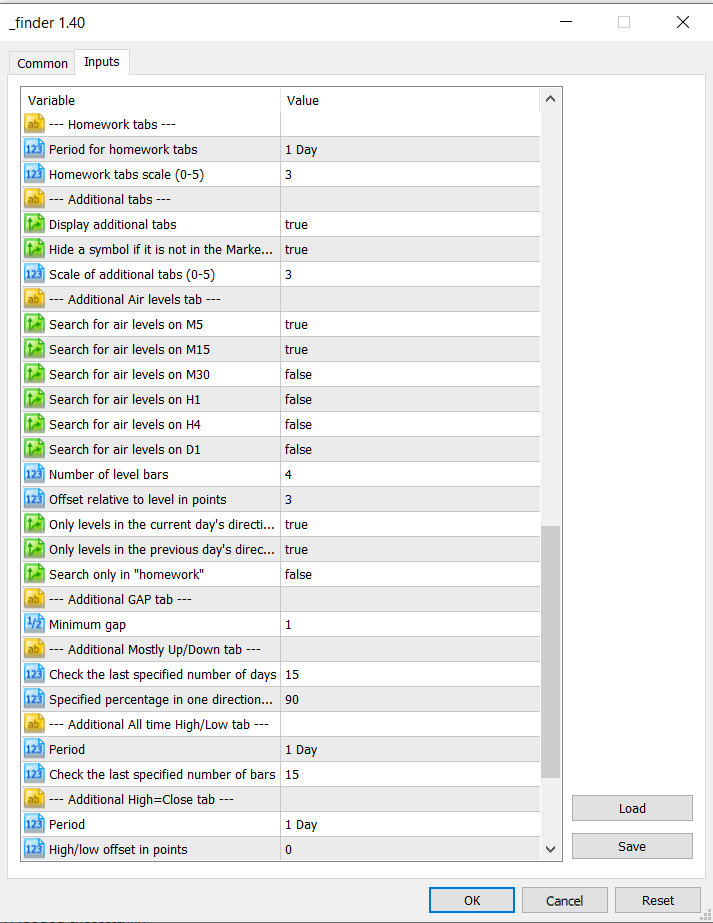
The last groups of settings are Opening a chart in a new window and External data.

The settings in the Opening a chart in a new window affect a period and scale of charts opened when clicking New windows.
More details on the utility's functionality can be found in the previous articles of the series.
Translated from Russian by MetaQuotes Ltd.
Original article: https://www.mql5.com/ru/articles/5614
 How to visualize multicurrency trading history based on HTML and CSV reports
- Free trading apps
- Over 8,000 signals for copying
- Economic news for exploring financial markets
You agree to website policy and terms of use