Discussion of article "Selection and navigation utility in MQL5 and MQL4: Adding data to charts"
I think it's a very interesting utility, so far I've started to test it. thanks
something is not working correctly in mt4. everything is normal in mt5
Roman, good afternoon. I have a problem with displaying on a monitor with high resolution ( 4K). How can you solve this problem?
Files:
Screenshot_1.jpg
624 kb
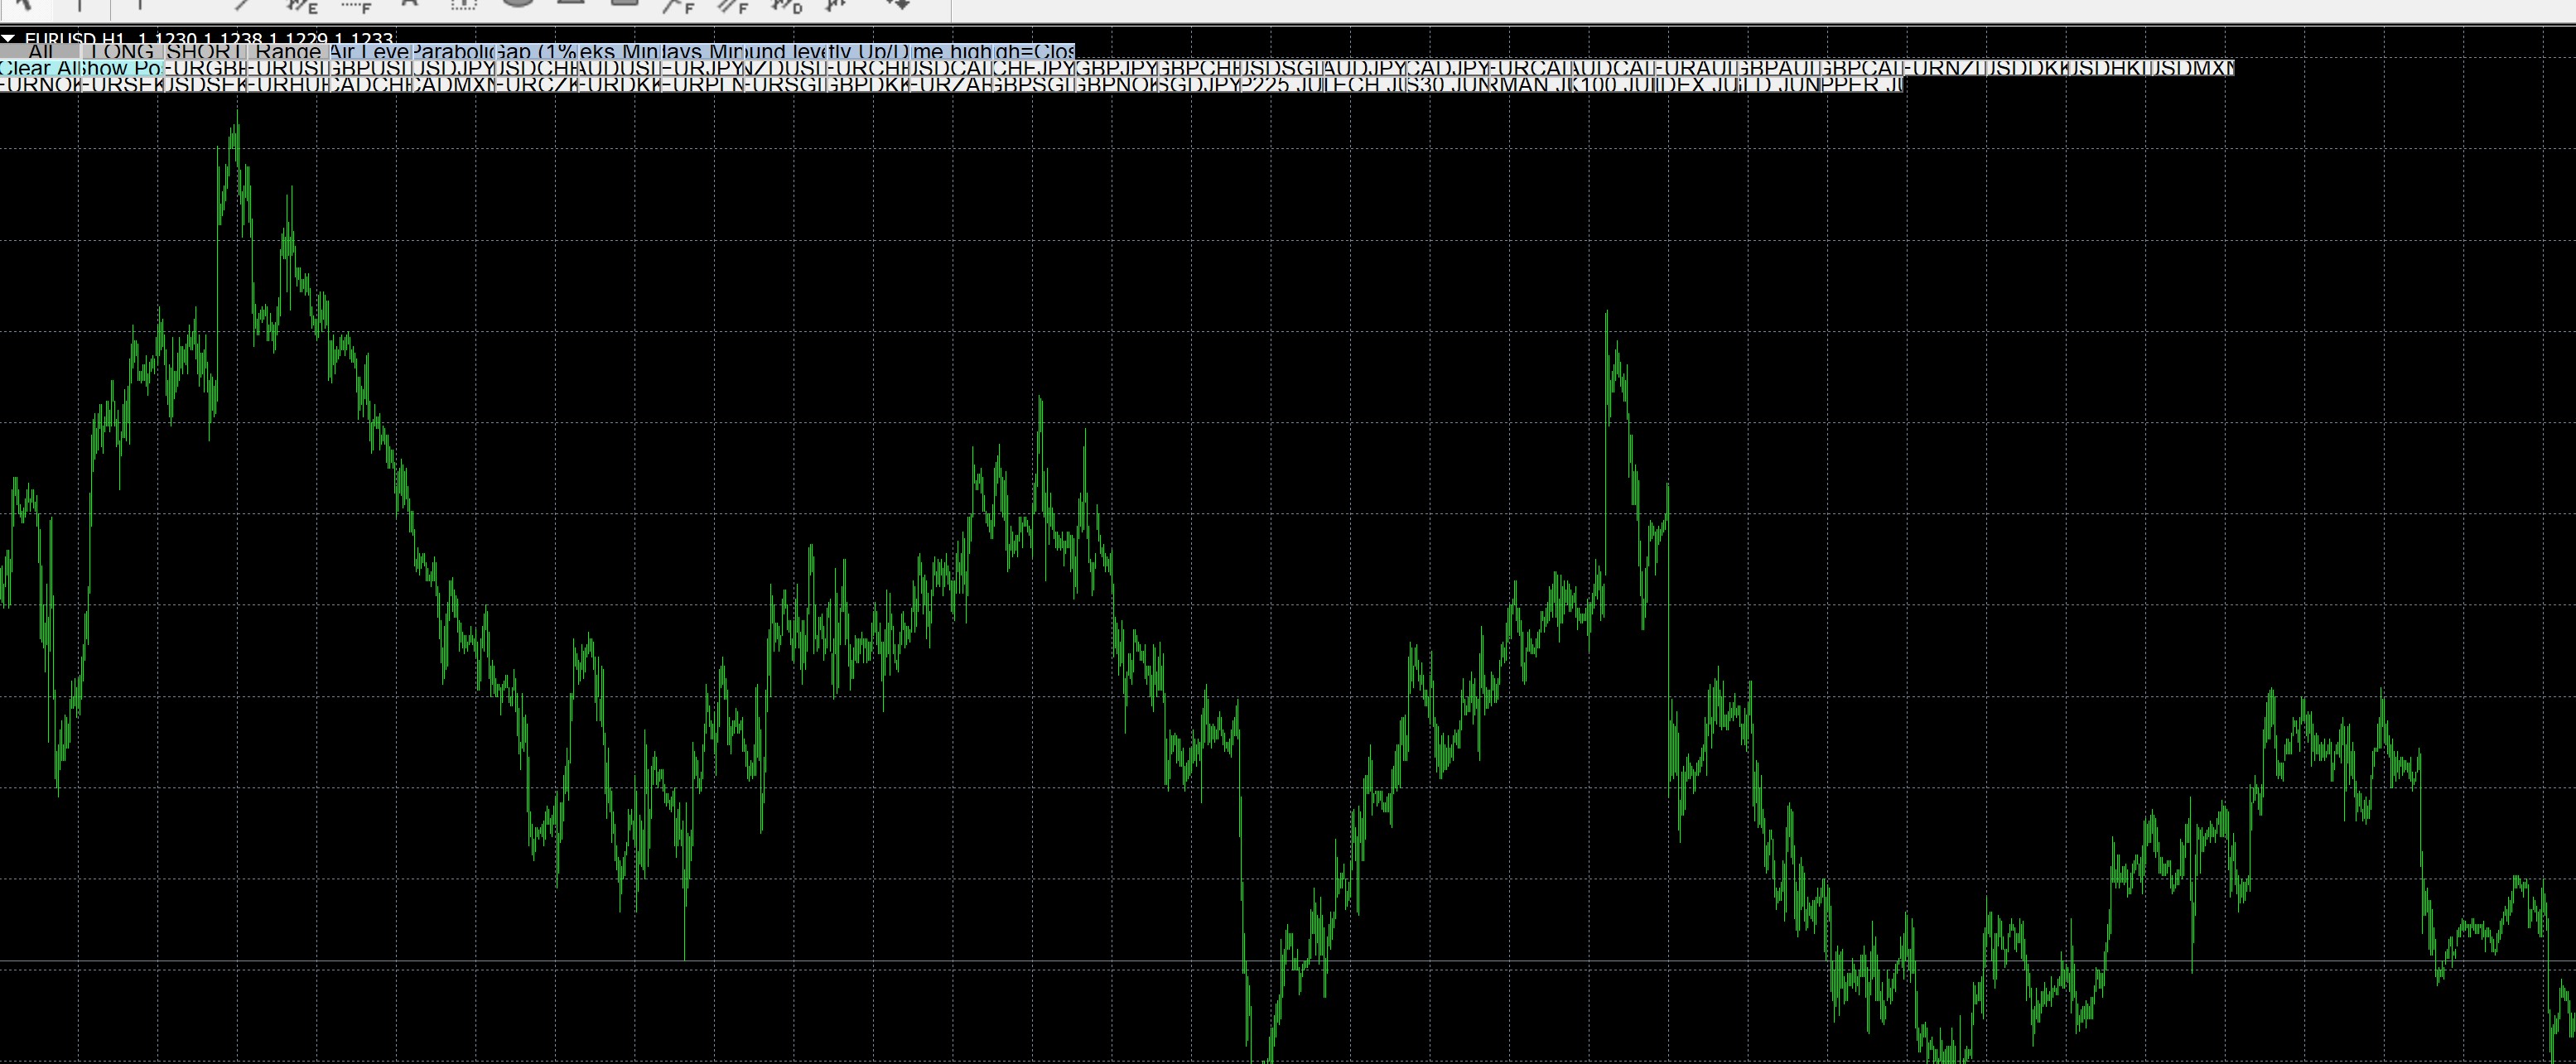
Thank you very much!
- There is one warning, but it doesn't affect the speed.

You are missing trading opportunities:
- Free trading apps
- Over 8,000 signals for copying
- Economic news for exploring financial markets
Registration
Log in
You agree to website policy and terms of use
If you do not have an account, please register
New article Selection and navigation utility in MQL5 and MQL4: Adding data to charts has been published:
In this article, we will continue expanding the functionality of the utility. This time, we will add the ability to display data that simplifies our trading. In particular, we are going to add High and Low prices of the previous day, round levels, High and Low prices of the year, session start time, etc.
This is most probably the last article in the series. I hope, the resulting utility will be useful to you.
But if you lack some functionality, write me about it. I will continue improving the utility in case there are enough missing pieces of functionality to write a new article.
In conclusion, let's summarize and briefly review the functionality we have implemented during this series of articles.
After launching the utility, we gain access to a list of tools meeting our conditions. Above the list, we can see the buttons of All, LONG, SHORT and Range tabs, as well as auto sorting tabs. The All tab is opened by default:
In the chart comment, you can see the line starting with update. This line contains the time of the last tab contents update. Press R to update the current tab manually. Besides, you can specify the currently open tab contents update periodicity (in seconds) in the utility settings.
Author: Roman Klymenko