Plotting trend lines based on fractals using MQL4 and MQL5
Table of Contents
- Introduction
- 1. Input parameters, DeInit() function and initial declaration of variables
- 2. Searching for nearest fractals
- 3. Determining price and time values of fractals
- 4. Creating objects and editing their properties. Redrawing the lines
- 5. Checking the bars history loading
- 6. Signals of trend lines breakthroughs, push notifications
- 7. Practical use of trend lines in trading
- Conclusion
Introduction
Recently, I have been thinking about using trend lines. There was a question about choosing a method of determining the points for plotting lines, and also about plotting accuracy. I decided to use fractals as a basis.
I often analyze markets at my main job where I can spend some time on trading. Also, you can't just draw the lines on a larger timeframe - the line should be plotted by extreme points with accuracy up to 15 minutes. The reason for this is that the fractal time on a larger timeframe doesn't always match the time of the same extreme point on M15. In short, this is where automation comes to help. It happened that I began writing the code using MQL5 and then moved to MQL4, because I needed this program for MetaTrader 4.
In this article I presented my solution of the problem using MQL4 and MQL5. The article provides the comparative view, but it would be inappropriate to compare the efficiency of MQL4 and MQL5 here. Also, I understand that there are probably other solutions, more effective than mine. The article can be useful to beginners who write scripts using either MQL4 or MQL5, especially to those who plan to use fractals and trend lines.
1. Input parameters, DeInit() function and initial declaration of variables
I used the following variables as input parameters:
input color Resistance_Color=Red;       // setting the resistance line color
input ENUM_LINE_STYLE Resistance_Style; // setting the resistance line style
input int Resistance_Width=1;           // setting the resistance line width
input color Support_Color=Red;          // setting the support line color
input ENUM_LINE_STYLE Support_Style;    // setting the support line style
input int Support_Width=1;              // setting the support line width
These parameters are the same for MQL4 and MQL5.
In MQL5 we need to create the indicator in advance:
//--- iFractals indicator handle
int Fractal;
//+------------------------------------------------------------------+
//| Expert initialization function                                   |
//+------------------------------------------------------------------+
int OnInit()
  {
//--- getting the iFractals indicator handle
   Fractal=iFractals(Symbol(),PERIOD_D1);
//---
   return(INIT_SUCCEEDED);
  }
Because the program will be drawing graphical objects, it makes sense to remove them when removing the Expert Advisor from the chart:
void OnDeinit(const int reason)
  {
   ObjectDelete(0,"TL_Resistance");
   ObjectDelete(0,"TL_Support");
  }
Plotting two lines (support and resistance) requires four points. To determine the line passing point we need to know the time and price .
The coordinates are determined in this order: first, we find the extreme bar, knowing the extreme bar we can determine the price and time of the extreme point.
Declaring variables in the OnTick() function:
| MQL4 |
|---|
//--- declaration of variables int n,UpperFractal_1,UpperFractal_2,LowerFractal_1,LowerFractal_2; |
| MQL5 |
|---|
//--- declaration of variables int n,UpperFractal_1,UpperFractal_2,LowerFractal_1,LowerFractal_2; //--- declaring the arrays for writing values of the iFractal indicator buffer double FractalDown[],FractalUp[]; double UpFractal_1,UpFractal_2,LowFractal_1,LowFractal_2; |
First off, I declared only those variables which store indexes of bars with formed fractals.
In MQL4:
- n - the variable is needed for finding the nearest known fractal using the for loop operator;
- UpperFractal_1, UpperFractal_2, LowerFractal_1, LowerFractal_2 - these variables will store the index of a bar at the first and the second nearest extreme point with the highest/lowest price (in terms of determining fractals);
In MQL5 we introduce additional variables:
- FractalDown[],FractalUp[]; - declaring arrays of double values for storing the values of the iFractals indicator buffer;
- Next, the double type variables: UpFractal_1,UpFractal_2,LowFractal_1,LowFractal_2. They will store the price values of extreme points.
2. Searching for nearest fractals
To find the index of a bar with a formed fractal we use the for loop operator.
Let's determine the indexes of the first two bars which correspond to the first and second upper fractals:
| MQL4 |
|---|
//--- finding the bar index of the first nearest upper fractal for(n=0; n<(Bars-1);n++) { if(iFractals(NULL,1440,MODE_UPPER,n)!=NULL) break; UpperFractal_1=n+1; } //--- finding the bar index of the second nearest upper fractal for(n=UpperFractal_1+1; n<(Bars-1);n++) { if(iFractals(NULL,1440,MODE_UPPER,n)!=NULL) break; UpperFractal_2=n+1; } |
| MQL5 |
|---|
//--- first, we need to write the Fractal indicator buffer values into the arrays //--- filling arrays with buffer values CopyBuffer(Fractal,0,TimeCurrent(),Bars(Symbol(),PERIOD_D1),FractalUp); CopyBuffer(Fractal,1,TimeCurrent(),Bars(Symbol(),PERIOD_D1),FractalDown); //--- indexing like in timeseries ArraySetAsSeries(FractalUp,true); ArraySetAsSeries(FractalDown,true); //--- next, we use the for loop operator to find the first upper fractal for(n=0; n<Bars(Symbol(),PERIOD_D1); n++) { //--- if the value is not empty, break the loop if(FractalUp[n]!=EMPTY_VALUE) break; } //--- writing the price value of the first fractal into the variable UpFractal_1=FractalUp[n]; //--- writing the index of the first fractal into the variable UpperFractal_1=n; //--- finding the second upper fractal for(n=UpperFractal_1+1; n<Bars(Symbol(),PERIOD_D1); n++) { if(FractalUp[n]!=EMPTY_VALUE) //if the value is not empty, break the loop break; } //--- writing the price value of the second fractal into the variable UpFractal_2=FractalUp[n]; //--- writing the index of the second fractal into the variable UpperFractal_2=n; |
Here I clearly demonstrated one of the key differences between MQL5 and MQL4 - using the functions for accessing timeseries.
In MQL4 I immediately started finding the index of the bar with a formed fractal, but in MQL5 I specified the FractalUp[] and FractalDown[] arrays for storing the price values of upper and lower fractals by accessing the iFractals indicator with the CopyBuffer() function. Next, I set the indexing of these arrays as in timeseries using the ArraySetAsSeries() function.
In MQL4 I got only indexes of the bars with known fractals, but in MQL5 I used the CopyBuffer() function to get the bar indexes and the price values of fractals.
Similarly, we find first two lower fractals:
| MQL4 |
|---|
//--- finding the bar index of the first nearest lower fractal for(n=0; n<(Bars-1);n++) { if(iFractals(NULL,1440,MODE_LOWER,n)!=NULL) break; LowerFractal_1=n+1; } //--- finding the bar index of the second nearest lower fractal for(n=LowerFractal_1+1; n<(Bars-1);n++) { if(iFractals(NULL,1440,MODE_LOWER,n)!=NULL) break; LowerFractal_2=n+1; } |
| MQL5 |
|---|
//--- finding the values of the lower fractals //--- finding the first lower fractal for(n=0; n<Bars(Symbol(),PERIOD_D1); n++) { //--- if the value is not empty, break the loop if(FractalDown[n]!=EMPTY_VALUE) break; } //--- writing the price value of the first fractal into the variable LowFractal_1=FractalDown[n]; //--- writing the index of the first fractal into the variable LowerFractal_1=n; //--- finding the second lower fractal for(n=LowerFractal_1+1; n<Bars(Symbol(),PERIOD_D1); n++) { if(FractalDown[n]!=EMPTY_VALUE) break; } //--- writing the price value of the second fractal into the variable LowFractal_2=FractalDown[n]; //--- writing the index of the second fractal into the variable LowerFractal_2=n; |
As you see, the code is very similar in MQL4 and MQL5. There is a slight difference in syntax.
3. Determining price and time values of fractals
To draw the line we need to determine the time and price of a fractal. Of course, in MQL4 we could simply use the High[] and Low[] predefined timeseries, and the iTime() function, however we also need to get more precise time coordinates to ensure the correct plotting of the trend line.
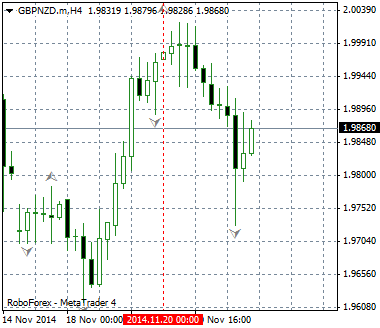
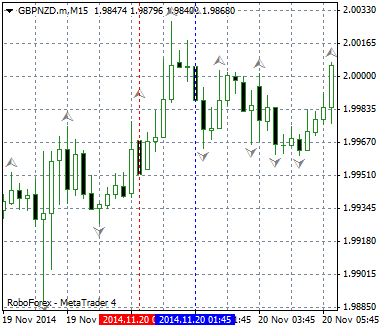
Fig. 1-2 show the difference between the time values of extreme points on H4 and M15 timeframes.

Fig.1. The extreme point time value on H4

Fig.2. The extreme point time value on M15
I came to a conclusion that the extreme point accuracy of 15 minutes is quite sufficient for my purposes.
In general, the principle of extreme point clarification is almost the same for both MQL4 and MQL5, but there are certain differences in details:
| MQL4 | MQL5 |
|---|---|
|
|
The code for each step is shown below:
| MQL4 |
|---|
// Step 1. Determining the extreme point time value on a larger timeframe: //--- determining the time of fractals datetime UpFractalTime_1=iTime(NULL, 1440,UpperFractal_1); datetime UpFractalTime_2=iTime(NULL, 1440,UpperFractal_2); datetime LowFractalTime_1=iTime(NULL, 1440,LowerFractal_1); datetime LowFractalTime_2=iTime(NULL, 1440,LowerFractal_2); |
// Step 2. Determining the index of the extreme bar on a smaller timeframe: //--- finding the fractal index on M15 int UpperFractal_1_m15=iBarShift(NULL, 15, UpFractalTime_1,true); int UpperFractal_2_m15=iBarShift(NULL, 15, UpFractalTime_2,true); int LowerFractal_1_m15=iBarShift(NULL, 15, LowFractalTime_1,true); int LowerFractal_2_m15=iBarShift(NULL, 15, LowFractalTime_2,true); |
// Step 3. Using the arrays to find the clarified extreme points on М15: //--- using the arrays to find the clarified extreme points //--- introducing the i variable to use in the for loop operator int i; //--- 1. First, find the lower extreme points //--- 3.1 Finding the first lower extreme point //--- declaring the array for storing the index values of the bars int Lower_1_m15[96]; //--- declaring the array for storing the price values double LowerPrice_1_m15[96]; //--- starting the for loop: for(i=0;i<=95;i++) { //--- filling the array with the bar index values Lower_1_m15[i]=LowerFractal_1_m15-i; //--- filling the array with the price values LowerPrice_1_m15[i]=iLow(NULL,15,LowerFractal_1_m15-i); } //--- determining the minimum price value in the array int LowestPrice_1_m15=ArrayMinimum(LowerPrice_1_m15,WHOLE_ARRAY,0); //--- determining the bar with the lowest price in the array int LowestBar_1_m15=Lower_1_m15[LowestPrice_1_m15]; //--- determining the time of the lowest price bar datetime LowestBarTime_1_m15=iTime(NULL,15,Lower_1_m15[LowestPrice_1_m15]); //--- 3.2 Finding the second lower extreme point int Lower_2_m15[96]; double LowerPrice_2_m15[96]; for(i=0;i<=95;i++) { //--- filling the array with the bar index values Lower_2_m15[i]=LowerFractal_2_m15-i; //--- filling the array with the price values LowerPrice_2_m15[i]=iLow(NULL,15,LowerFractal_2_m15-i); } //--- determining the minimum price value in the array int LowestPrice_2_m15=ArrayMinimum(LowerPrice_2_m15,WHOLE_ARRAY,0); //--- determining the bar with the lowest price in the array int LowestBar_2_m15=Lower_2_m15[LowestPrice_2_m15]; //--- determining the time of the lowest price bar datetime LowestBarTime_2_m15=iTime(NULL,15,Lower_2_m15[LowestPrice_2_m15]); //--- 3.3 Finding the first upper extreme point int Upper_1_m15[96]; double UpperPrice_1_m15[96]; for(i=0;i<=95;i++) { //--- filling the array with the bar index values Upper_1_m15[i]=UpperFractal_1_m15-i; //--- filling the array with the price values UpperPrice_1_m15[i]=iHigh(NULL,15,UpperFractal_1_m15-i); } //--- determining the maximum price value in the array int HighestPrice_1_m15=ArrayMaximum(UpperPrice_1_m15,WHOLE_ARRAY,0); //--- determining the bar with the highest price in the array int HighestBar_1_m15=Upper_1_m15[HighestPrice_1_m15]; //--- determining the time of the highest price bar datetime HighestBarTime_1_m15=iTime(NULL,15,Upper_1_m15[HighestPrice_1_m15]); //--- 3.4 Finding the second upper extreme point int Upper_2_m15[96]; double UpperPrice_2_m15[96]; for(i=0;i<=95;i++) { //--- filling the array with the bar index values Upper_2_m15[i]=UpperFractal_2_m15-i; //--- filling the array with the price values UpperPrice_2_m15[i]=iHigh(NULL,15,UpperFractal_2_m15-i); } |
| MQL5 |
|---|
// Step 1. Determining the extreme point time value on a larger timeframe: //--- declaring the arrays for storing the time values of the corresponding bar index on a larger timeframe datetime UpFractalTime_1[],LowFractalTime_1[],UpFractalTime_2[],LowFractalTime_2[]; //--- determining the time of fractals on a larger timeframe CopyTime(Symbol(),PERIOD_D1,UpperFractal_1,1,UpFractalTime_1); CopyTime(Symbol(),PERIOD_D1,LowerFractal_1,1,LowFractalTime_1); CopyTime(Symbol(),PERIOD_D1,UpperFractal_2,1,UpFractalTime_2); CopyTime(Symbol(),PERIOD_D1,LowerFractal_2,1,LowFractalTime_2); |
// Step 2. Determining the generation time of the next day bar: //--- determining the generation time of the next day bar (the stop time for CopyHigh(), CopyLow() and CopyTime()) datetime UpFractalTime_1_15=UpFractalTime_1[0]+86400; datetime UpFractalTime_2_15=UpFractalTime_2[0]+86400; datetime LowFractalTime_1_15=LowFractalTime_1[0]+86400; datetime LowFractalTime_2_15=LowFractalTime_2[0]+86400; |
// Step 3. Declaring and filling the arrays for storing the price and time values for the 15-minute timeframe: //--- declaring the arrays for storing the maximum and minimum price values double High_1_15[],Low_1_15[],High_2_15[],Low_2_15[]; //--- filling the arrays with the CopyHigh() and CopyLow() functions CopyHigh(Symbol(),PERIOD_M15,UpFractalTime_1[0],UpFractalTime_1_15,High_1_15); CopyHigh(Symbol(),PERIOD_M15,UpFractalTime_2[0],UpFractalTime_2_15,High_2_15); CopyLow(Symbol(),PERIOD_M15,LowFractalTime_1[0],LowFractalTime_1_15,Low_1_15); CopyLow(Symbol(),PERIOD_M15,LowFractalTime_2[0],LowFractalTime_2_15,Low_2_15); //--- declaring the arrays for storing the time values corresponding to the extreme bar indexes datetime High_1_15_time[],High_2_15_time[],Low_1_15_time[],Low_2_15_time[]; //--- filling the arrays CopyTime(Symbol(),PERIOD_M15,UpFractalTime_1[0],UpFractalTime_1_15,High_1_15_time); CopyTime(Symbol(),PERIOD_M15,UpFractalTime_2[0],UpFractalTime_2_15,High_2_15_time); CopyTime(Symbol(),PERIOD_M15,LowFractalTime_1[0],LowFractalTime_1_15,Low_1_15_time); CopyTime(Symbol(),PERIOD_M15,LowFractalTime_2[0],LowFractalTime_2_15,Low_2_15_time); |
// Step 4. Finding the lowest and highest price values, and the time values of the clarified extreme points: //--- determining the highest and lowest price and time values with the ArrayMaximum() and ArrayMinimum() functions int Max_M15_1=ArrayMaximum(High_1_15,0,96); int Max_M15_2=ArrayMaximum(High_2_15,0,96); int Min_M15_1=ArrayMinimum(Low_1_15,0,96); int Min_M15_2=ArrayMinimum(Low_2_15,0,96); |
Eventually, we have determined the following trend line coordinates:
1. For the support line:
| MQL4 | MQL5 |
|---|---|
|
|
2. For the resistance line:
| MQL4 | MQL5 |
|---|---|
|
|
4. Creating objects and editing their properties. Redrawing the lines
Now, when we know the coordinates of the line, we only need to create the graphical objects:
| MQL4 |
|---|
//--- creating the support line ObjectCreate(0,"TL_Support",OBJ_TREND,0,LowestBarTime_2_m15,LowerPrice_2_m15[LowestPrice_2_m15], LowestBarTime_1_m15,LowerPrice_1_m15[LowestPrice_1_m15]); ObjectSet("TL_Support",OBJPROP_COLOR,Support_Color); ObjectSet("TL_Support",OBJPROP_STYLE,Support_Style); ObjectSet("TL_Support",OBJPROP_WIDTH,Support_Width); //--- creating the resistance line ObjectCreate(0,"TL_Resistance",OBJ_TREND,0,HighestBarTime_2_m15,UpperPrice_2_m15[HighestPrice_2_m15], HighestBarTime_1_m15,UpperPrice_1_m15[HighestPrice_1_m15]); ObjectSet("TL_Resistance",OBJPROP_COLOR,Resistance_Color); ObjectSet("TL_Resistance",OBJPROP_STYLE,Resistance_Style); ObjectSet("TL_Resistance",OBJPROP_WIDTH,Resistance_Width); |
| MQL5 |
|---|
//--- creating the support line ObjectCreate(0,"TL_Support",OBJ_TREND,0,Low_2_15_time[Min_M15_2],Low_2_15[Min_M15_2],Low_1_15_time[Min_M15_1],Low_1_15[Min_M15_1]); ObjectSetInteger(0,"TL_Support",OBJPROP_RAY_RIGHT,true); ObjectSetInteger(0,"TL_Support",OBJPROP_COLOR,Support_Color); ObjectSetInteger(0,"TL_Support",OBJPROP_STYLE,Support_Style); ObjectSetInteger(0,"TL_Support",OBJPROP_WIDTH,Support_Width); //--- creating the resistance line ObjectCreate(0,"TL_Resistance",OBJ_TREND,0,High_2_15_time[Max_M15_2],High_2_15[Max_M15_2],High_1_15_time[Max_M15_1],High_1_15[Max_M15_1]); ObjectSetInteger(0,"TL_Resistance",OBJPROP_RAY_RIGHT,true); ObjectSetInteger(0,"TL_Resistance",OBJPROP_COLOR,Resistance_Color); ObjectSetInteger(0,"TL_Resistance",OBJPROP_STYLE,Resistance_Style); ObjectSetInteger(0,"TL_Resistance",OBJPROP_WIDTH,Resistance_Width); |
So I created the necessary lines and specified their parameters based on the input parameters.
Now we need to implement redrawing of the trend lines.
When the market situation changes, for example, when a new extreme point appears, we can just remove the existing line:
| MQL4 |
|---|
//--- redrawing the support line //--- writing the values of the support line time coordinates into the variables datetime TL_TimeLow2=ObjectGet("TL_Support",OBJPROP_TIME2); datetime TL_TimeLow1=ObjectGet("TL_Support",OBJPROP_TIME1); //--- if the line coordinates don't match the current coordinates if(TL_TimeLow2!=LowestBarTime_1_m15 && TL_TimeLow1!=LowestBarTime_2_m15) { //--- remove the line ObjectDelete(0,"TL_Support"); } //--- redrawing the resistance line //--- writing the values of the resistance line time coordinates into the variables datetime TL_TimeUp2=ObjectGet("TL_Resistance",OBJPROP_TIME2); datetime TL_TimeUp1=ObjectGet("TL_Resistance",OBJPROP_TIME1); //--- if the line coordinates don't match the current coordinates if(TL_TimeUp2!=HighestBarTime_1_m15 && TL_TimeUp1!=HighestBarTime_2_m15) { //--- remove the line ObjectDelete(0,"TL_Resistance"); } |
| MQL5 |
|---|
//--- redrawing the support line //--- writing the values of the support line time coordinates into the variables datetime TL_TimeLow2=(datetime)ObjectGetInteger(0,"TL_Support",OBJPROP_TIME,0); datetime TL_TimeLow1=(datetime)ObjectGetInteger(0,"TL_Support",OBJPROP_TIME,1); //--- if the line coordinates don't match the current coordinates if(TL_TimeLow2!=Low_2_15_time[Min_M15_2] && TL_TimeLow1!=Low_1_15_time[Min_M15_1]) { //--- remove the line ObjectDelete(0,"TL_Support"); } //--- redrawing the resistance line //--- writing the values of the resistance line time coordinates into the variables datetime TL_TimeUp2=(datetime)ObjectGetInteger(0,"TL_Resistance",OBJPROP_TIME,0); datetime TL_TimeUp1=(datetime)ObjectGetInteger(0,"TL_Resistance",OBJPROP_TIME,1); //--- if the line coordinates don't match the current coordinates if(TL_TimeUp2!=High_2_15_time[Max_M15_2] && TL_TimeUp1!=High_1_15_time[Max_M15_1]) { //--- remove the line ObjectDelete(0,"TL_Resistance"); } |
5. Checking the bars history loading
During the testing, I realized that the lines didn't always draw correctly.
At first, I thought there was a bug in the code or my solution didn't work at all, but then I realized that the problem was caused by insufficient loading of the bar history on a smaller timeframe, M15 in my case. To warn the user about these issues, I decided to make the program additionally check if a bar exists on M15.
For this purpose, in MQL4 I used the iBarShift() function capabilities which I originally used in the section "Determining price and time values of fractals".
If a bar is not found, the iBarShift() function returns -1. Therefore, we can output this warning:
| MQL4 |
|---|
//--- checking the bars history loading //--- if at least one bar is not found on M15 if(UpperFractal_1_m15==-1 || UpperFractal_2_m15==-1 || LowerFractal_1_m15==-1 || LowerFractal_2_m15==-1) { Alert("The loaded history is insufficient for the correct work!"); } |
In MQL5 I used the Bars() function which returns an empty value, if the timeseries data haven't been generated in the terminal:
//--- checking the bars history loading //--- 1. determining the number of bars on a specified timeframe int High_M15_1=Bars(Symbol(),PERIOD_M15,UpFractalTime_1[0],UpFractalTime_1_15); int High_M15_2=Bars(Symbol(),PERIOD_M15,UpFractalTime_2[0],UpFractalTime_2_15); int Low_M15_1=Bars(Symbol(),PERIOD_M15,LowFractalTime_1[0],LowFractalTime_1_15); int Low_M15_2=Bars(Symbol(),PERIOD_M15,LowFractalTime_2[0],LowFractalTime_2_15); //--- 2. check if the loaded history is insufficient for the correct line drawing //--- if at least one bar is not found if(High_M15_1==0 || High_M15_2==0 || Low_M15_1==0 || Low_M15_2==0) { Alert("The loaded history is insufficient for the correct work!"); } |
6. Signals of trend lines breakthroughs, push notifications
To complete the picture, I decided to implement a signal of the trend line breakthrough. The trend line is plotted through the extreme points of the day timeframe, but to identify the breakthrough earlier, the bar must be closed lower or higher than the trend line on H4.
In general, we can break the process into three steps:
- Determine the bar closing price and the trend line price;
- Determine the conditions in which the price breaks through the trend line;
- Send the push notification about the breakthrough.
| MQL4 |
|---|
// 1. Getting the price parameters of the trend line //--- determining the closing price of a bar with index 1 double Price_Close_H4=iClose(NULL,240,1); //--- determining the time of a bar with index 1 datetime Time_Close_H4=iTime(NULL,240,1); //--- determining the bar index on H4 int Bar_Close_H4=iBarShift(NULL,240,Time_Close_H4); //--- determining the price of the line on H4 double Price_Resistance_H4=ObjectGetValueByShift("TL_Resistance",Bar_Close_H4); //--- determining the price of the line on H4 double Price_Support_H4=ObjectGetValueByShift("TL_Support",Bar_Close_H4); |
// 2. Conditions for trend line breakthroughs //--- for breaking through the support line bool breakdown=(Price_Close_H4<Price_Support_H4); //--- for braking through the resistance line bool breakup=(Price_Close_H4>Price_Resistance_H4); |
// 3. Delivering the push notifications if(breakdown==true) { //--- send no more than one notification per 4 hours int SleepMinutes=240; static int LastTime=0; if(TimeCurrent()>LastTime+SleepMinutes*60) { LastTime=TimeCurrent(); SendNotification(Symbol()+"The price has broken through the support line"); } } if(breakup==true) { //--- send no more than one notification per 4 hours SleepMinutes=240; LastTime=0; if(TimeCurrent()>LastTime+SleepMinutes*60) { LastTime=TimeCurrent(); SendNotification(Symbol()+"The price has broken through the resistance line"); } } |
| MQL5 |
|---|
// 1. Getting the price parameters of the trend line double Close[]; CopyClose(Symbol(),PERIOD_H4,TimeCurrent(),10,Close); //--- setting the array indexing order ArraySetAsSeries(Close,true); //--- datetime Close_time[]; CopyTime(Symbol(),PERIOD_H4,TimeCurrent(),10,Close_time); //--- setting the array indexing order ArraySetAsSeries(Close_time,true); //--- double Price_Support_H4=ObjectGetValueByTime(0,"TL_Support",Close_time[1]); double Price_Resistance_H4=ObjectGetValueByTime(0,"TL_Resistance",Close_time[1]); |
// 2. Conditions for trend line breakthroughs bool breakdown=(Close[1]<Price_Support_H4); bool breakup=(Close[1]>Price_Resistance_H4); |
// 3. Delivering the push notifications if(breakdown==true) { //--- send no more than one notification per 4 hours int SleepMinutes=240; static int LastTime=0; if(TimeCurrent()>LastTime+SleepMinutes*60) { LastTime=(int)TimeCurrent(); SendNotification(Symbol()+"The price has broken through the support line"); } } if(breakup==true) { //--- send no more than one notification per 4 hours int SleepMinutes=240; static int LastTime=0; if(TimeCurrent()>LastTime+SleepMinutes*60) { LastTime=(int)TimeCurrent(); SendNotification(Symbol()+"The price has broken through the resistance line"); } } |
To identify a breakthrough, I used the ObjectGetValueByShift() function in MQL4 and the ObjectGetValueByTime() function in MQL5.
Perhaps, I could just set 1 instead of Bar_Close_H4 as a parameter for ObjectGetValueByShift(), but I decided to determine the index on H4 first. I used the solution for limiting the number of sent messages published on this forum thread, and I would like to thank the author very much.
7. Practical use of trend lines in trading
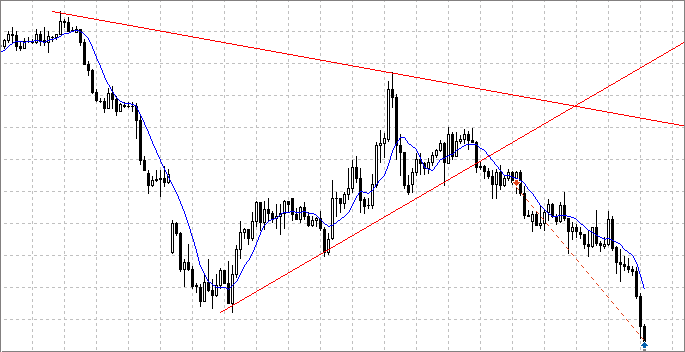
The most simple way: identify a breakthrough, wait for a pullback and enter the market after it.
Ideally, you should get something like this:

Fig. 3. Trend line breakthrough
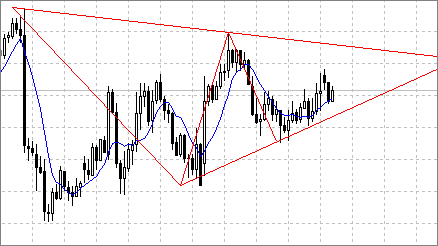
You can then use your imagination and try to identify the formations, i.e. the patterns of technical analysis, for example, a triangle:

Fig.4. Triangle pattern
The lines haven't been clarified by a smaller timeframe on the images above.
Conclusion
This concludes the article, I hope you will find it useful. The article was intended for beginners in programming, for amateurs like me.
I learned a lot when writing this article: first, I started to make more meaningful code comments; second, at the beginning I had a more cumbersome and complex solution for extreme points clarification, but then I came up with a more simple solution which I demonstrated here.
Thank you for reading, any feedback is appreciated.
Translated from Russian by MetaQuotes Ltd.
Original article: https://www.mql5.com/ru/articles/1201
 Tips for Purchasing a Product on the Market. Step-By-Step Guide
 Trading Ideas Based on Prices Direction and Movement Speed
 MQL5 Cookbook: Implementing an Associative Array or a Dictionary for Quick Data Access
 Bi-Directional Trading and Hedging of Positions in MetaTrader 5 Using the HedgeTerminal API, Part 2
- Free trading apps
- Over 8,000 signals for copying
- Economic news for exploring financial markets
You agree to website policy and terms of use
Hi Almat,
I am not getting trendlines in chart, but I am getting continuous mobile alerts. Please help if I miss anything.
thanks,
Prakash.R
Hi,
1. You need compile mq4 file in the metaeditor;
2. I think that you have trendlines in chart, but you do not see them because of the scale of chart
Hi - I cannot pretend to understand all of the coding, but I am working my way through it as it does exactly what I have been trying to code myself (badly as very much a novice).
I have recreated the EA and successfully complied in MQL4 and on first initialisation it will draw the support and resistance lines and will send the notifications but it doesn't redraw NEW support and resistance lines when NEW extreme point fractals appear- is it supposed too? Is there something I am missing something.
Also I couldn't get the fractals to show on the chart but testing the EA in strategy tester the fractals would correctly appear after stopping the test?? Any ideas what I a missing again?
Genius work by the way, fractals and trend lines against the extreme points is not easy to explain let alone code it :)
Best Regards
Andy
Hi, about first question: if it doesn't redraw new trendlines maybe you don't used code, which delete created objects. Look 4-th part of article. About second question: you can create new template with fractals for tester and called it "tester.tpl". Thereafter fractals will always show on the chart when you use tester
Hi, about first question: if it doesn't redraw new trendlines maybe you don't used code, which delete created objects. Look 4-th part of article. About second question: you can create new template with fractals for tester and called it "tester.tpl". Thereafter fractals will always show on the chart when you use tester
Thanks for the reply, I left the EA attached to two charts overnight (1x 4hr chart and 1x 15m=M chart) and it has redrawn them so my bad for little patience.
Thanks for the tip regarding tester.pl.
Many thanks
Thank you for your article, I will explore the idea and try to adapt it for my EA's.
Thanks again and happy trading.