Key Swing Levels MT5
- Indikatoren
- Version: 1.0
- Aktivierungen: 10
Dieser dynamische Indikator zeichnet die wichtigsten Swing High und Low Levels für jedes Symbol auf jedem Zeitrahmen!
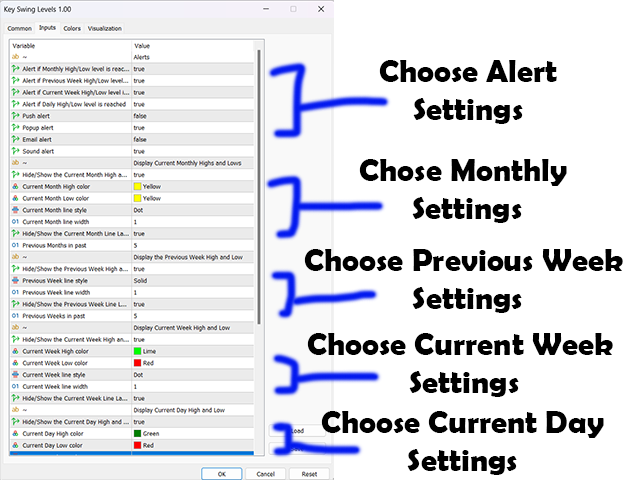
Der Benutzer kann jedes Level oder Label ein- oder ausblenden und erhält außerdem Warnungen, wenn der Preis zu diesem Schlüssel-Level zurückkehrt, per Pop-Up, Push, E-Mail oder Ton.
Zu den Niveaus gehören: Höchst-/Tiefstkurs des aktuellen Tages, Höchst-/Tiefstkurs des Vortages, Höchst-/Tiefstkurs der aktuellen Woche, Höchst-/Tiefstkurs der Vorwoche und monatlicher Höchst-/Tiefstkurs.
Die Levels sind mit den daneben aufgelisteten Preispunktdaten beschriftet, um eine schnelle und einfache Referenz zu ermöglichen.
Sie können den Stil, die Größe und die Farbe jeder Level-Linie und Beschriftung ändern.
Mit diesem Indikator sparen Sie Zeit und müssen diese Linien nicht mehr identifizieren und immer wieder einzeichnen.
Sie können sich nun auf Ihre Strategie konzentrieren und diese Linien als Schlüsselniveaus für Unterstützung, Widerstand und Gewinnmitnahme nutzen!!!
Kostenlose Produkte, die Ihnen auch gefallen könnten, finden Sie hier:
ADR Umkehrindikator: https: //www.mql5.com/en/market/product/94148
Fibonacci Retracements und Erweiterungen Tool: https: //www.mql5.com/en/market/product/94303
Crossover-Warnungen für mehrere gleitende Durchschnitte: https://www.mql5.com/en/market/product/94369