The wave rider
- Indikatoren
- Version: 5.0
- Aktivierungen: 5

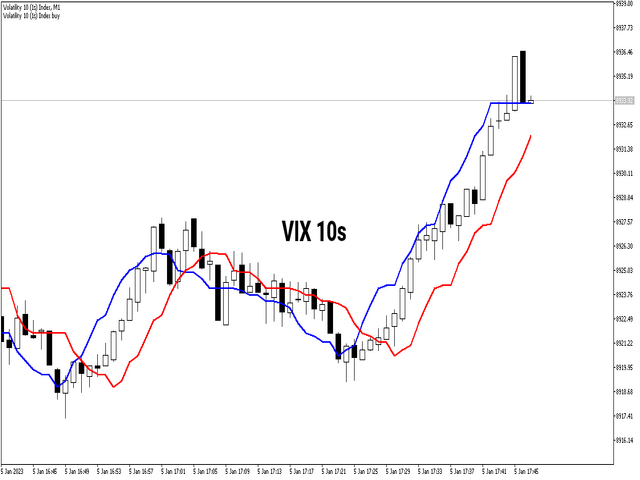
Der Trend Snatcher ist ein Multi-Timeframe-Indikator, der Schwankungen auf dem Kursmarktchart erkennt. Wichtige Niveaus, wie z.B. Angebots- und Nachfrageniveaus, Berührungen von Trendlinien, Umkehrmuster und andere, können bei Handelsentscheidungen ebenfalls als Zusammenfluss hinzugefügt werden.
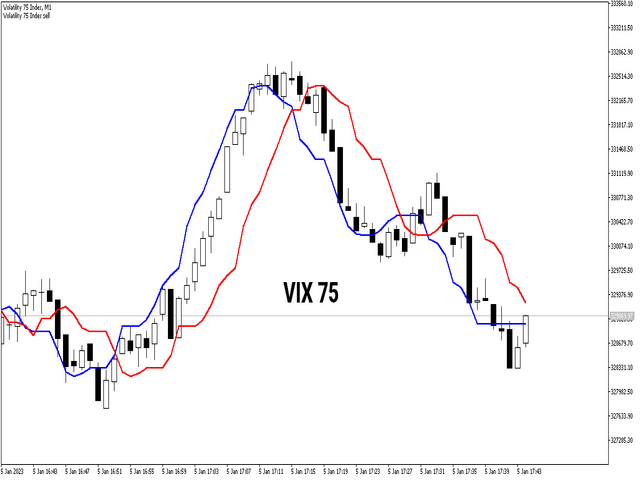
Der Indikator verwendet zwei Linien, die auf das höchste Verkaufsniveau und das niedrigste Kaufniveau abzielen. Wenn sich die beiden Linien kreuzen, wird ein Signal generiert.
Alle Handelsinstrumente sind kompatibel, einschließlich Währungspaare, synthetische Indizes, Metalle, Kryptowährungen und NASDAQ.
Es kann als zusätzliche Confluence verwendet werden, um in einen Handel einzusteigen, wenn sich der Preis auf einem starken Unterstützungs- und Widerstandsniveau befindet oder die Trendlinie berührt. Er ist für Scalping und Swing Trading geeignet.
- E-Mail-Warnungen: Ja
- Ton-Benachrichtigungen: Ja
- Mobile Benachrichtigungen: Ja
- Verfügbare Einstellungen: Ja
- Verfügbarkeit: MT5 MT4
- Gepflegt und aktualisiert
- Direkt auf Ihrer MetaTrader 5 Software installiert