Multi Timeframe Indicator
- Indikatoren
- Version: 1.51
- Aktualisiert: 18 Oktober 2020

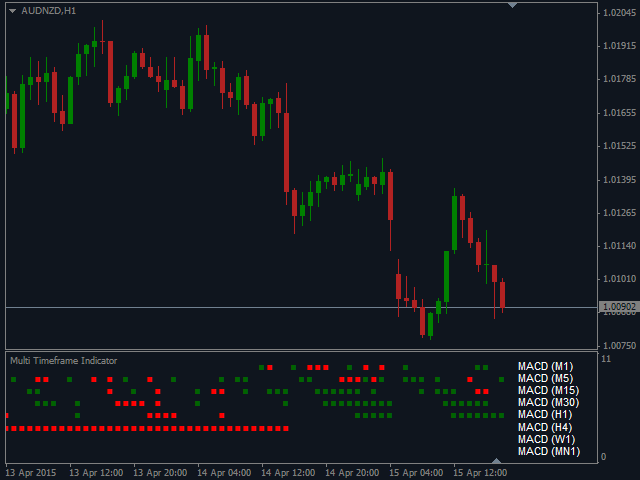
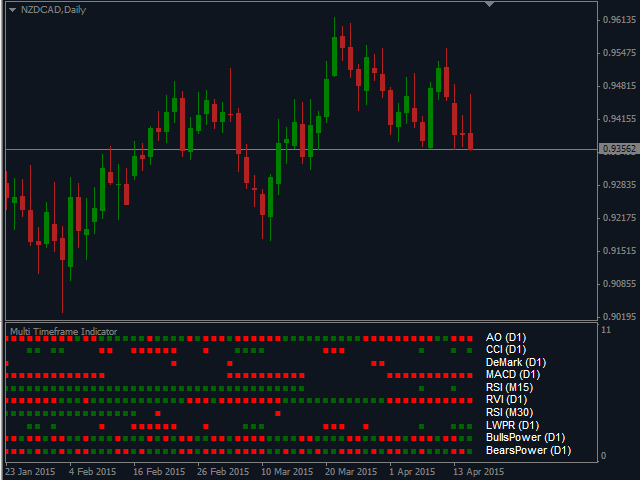
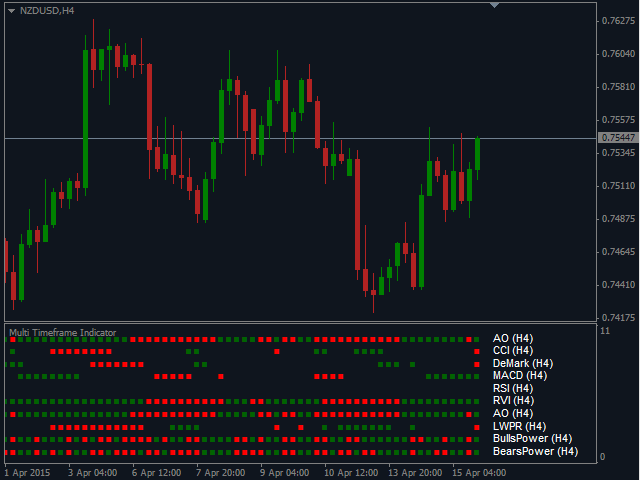
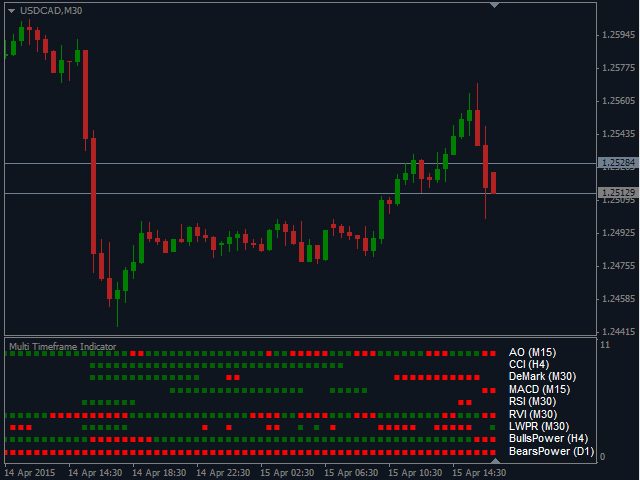
Multi Timeframe Indicator enthält eine Vielzahl von Funktionen und kann als universeller Helfer für den Trader betrachtet werden. Sein Hauptziel ist es, bis zu 10 Indikatoren gleichzeitig anzuzeigen und dabei nur einen kleinen Baustein für jeden von ihnen zu verwenden. Zu diesen Indikatoren gehören Awesome Oscillator, CCI, DeMarker, MACD, RSI, RVI, Stochastic, Larry Williams' Percent Range, Bulls Power und Bears Power. Eine wichtige Funktion des Indikators ist die Fähigkeit, Signale aus verschiedenen Zeitrahmen zu überwachen. Sie können verschiedene Kombinationen wählen, die entweder verschiedene Zeitrahmen eines Indikators oder mehrere Zeitrahmen verschiedener Indikatoren anzeigen.
Der Ansatz der Anzeige von Steinen in verschiedenen Zeitrahmen basiert auf dem Vorhandensein eines Signals zum Zeitpunkt der Eröffnung eines Balkens des aktuellen Zeitrahmens. Sie können also die Historie durchsehen und Parameter und einen Zeitrahmen für jeden Indikator auswählen, um die besten Ergebnisse zu erzielen - die Signale werden nicht neu gezeichnet. Der Einfachheit halber wird der Zeitrahmen, den Sie in den Anzeigeeinstellungen gewählt haben, in Klammern neben dem Namen des Indikators auf dem Chart angegeben. Wenn Sie alle Indikatoren nur auf dem Zeitrahmen des aktuell geöffneten Charts verwenden möchten, ohne die Multitimeframe-Funktion zu nutzen, können Sie diese Option ebenfalls auswählen. Sie können auch die Standardfarben und die Größe der Kauf- und Verkaufssteine sowie die Farbe des Indikatornamens und des Zeitrahmens in den Parametern ändern.
Es ist auch möglich, Benachrichtigungen mit verschiedenen Einstellungen zu aktivieren.
Parameter des Indikators
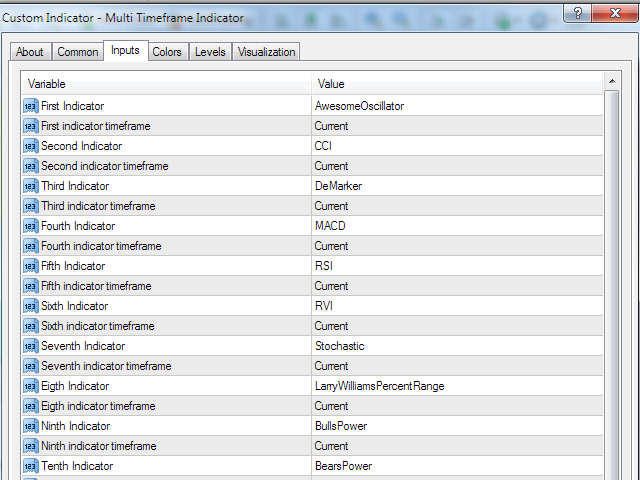
- Erster Indikator...Zehnter Indikator - wählen Sie vom ersten bis zum zehnten Indikator
- Zeitrahmendes ersten Indikators... Zeitrahmen deszehnten Indikators - Auswahl des Zeitrahmens für jeden Indikator
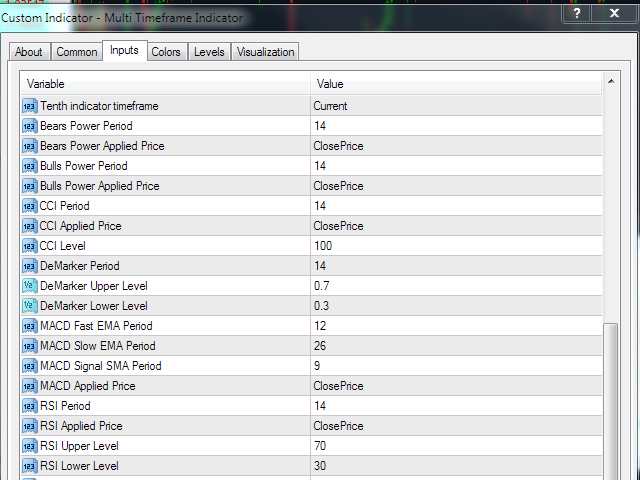
- Bears Power Periode - Periode des Bears Power Indikators
- Bears Power Applied Price - Preis, der für die Berechnung des Bears Power Indikators verwendet wird
- Bulls Power Periode - Periode des Bulls Power Indikators
- Bulls Power Applied Price - Preis, der für die Berechnung des Bulls Power Indikators verwendet wird
- CCI Zeitraum - Zeitraum des CCI Indikators
- CCI Applied Price - Preis, der für die Berechnung des CCI-Indikators verwendet wird
- CCI Level - Niveau des CCI Indikators. Ein Signal erscheint nach Überschreiten dieses Niveaus. Dieser Wert wird für das obere Niveau eingegeben. Für das untere Niveau wird er automatisch als negativer Wert berechnet.
- DeMarker Periode - Periode des DeMarker Indikators
- DeMarker Upper Level - oberes Niveau des DeMarker-Indikators. Ein Verkaufssignal erscheint nach Überschreiten dieses Niveaus
- DeMarker Lower Level - unteres Niveau des DeMarker Indikators. Ein Kaufsignal erscheint nach dem Überschreiten dieses Niveaus.
- MACD Fast EMA Periode - schnelle EMA MACD Periode
- MACD Slow EMA Zeitraum - langsamer EMA MACD Zeitraum
- MACD Signal SMA Zeitraum - Signal SMA MACD Zeitraum
- MACD Applied Price - Preis, der für die Berechnung des MACD-Indikators verwendet wird
- RSI Periode - Periode des RSI-Indikators
- RSI Applied Price - für die Berechnung des RSI-Indikators verwendeter Preis
- RSI Upper Level - oberes Niveau des RSI-Indikators. Ein Verkaufssignal erscheint nach Überschreiten dieses Niveaus
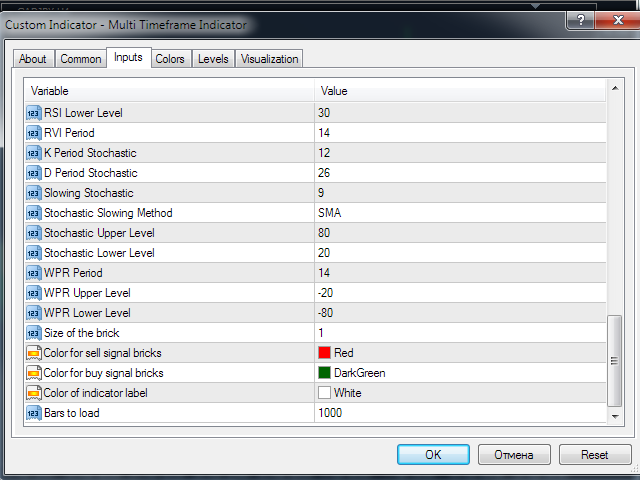
- RSI Lower Level - unteres Niveau des RSI-Indikators. Ein Kaufsignal erscheint nach dem Überschreiten dieses Niveaus
- RVI-Periode - Periode des RVI-Indikators
- K-Periode Stochastik - K-Periode des Stochastik-Indikators
- D-Periode Stochastik - D-Periode des Stochastik-Indikators
- Verlangsamte Stochastik - Mittelungszeitraum des Stochastik-Indikators
- Stochastische Verlangsamungsmethode - Mittelungsmethode des stochastischen Indikators
- Stochastisches oberes Niveau - oberes Niveau des Stochastik-Indikators. Ein Verkaufssignal erscheint nach Überschreiten dieses Niveaus
- Stochastisches unteres Niveau - unteres Niveau des Stochastik-Indikators. Ein Kaufsignal erscheint nach dem Überschreiten dieses Niveaus
- WPR-Periode - Periode der Larry Williams' Percent Range
- WPR Upper Level - oberes Niveau der Larry Williams' Percent Range. Ein Verkaufssignal erscheint nach dem Überschreiten dieses Niveaus
- WPR Lower Level - unteres Niveau der Larry Williams' Percent Range. Ein Kaufsignal erscheint nach dem Überschreiten dieses Niveaus
- Größe des Steins - Größe eines Steins, der ein Signal anzeigt
- Farbe für Verkaufssignal-Bausteine - Farbe des Verkaufssignal-Bausteins
- Farbe für Kaufsignal-Bausteine - Farbe des Kaufsignal-Bausteins
- Farbe der Indikatorbeschriftung - Farbe des Indikatornamens und des Zeitrahmens
- Bars to load - Anzahl der Bars für die Berechnung
- Aktivieren Sie den Alarmer - Alarm, wenn ein Signal gebildet wird
- Bricks of same color to alert - Anzahl der Bricks der gleichen Farbe, um einen Alarm auszulösen
- Suche nach Signalen auf dem aktuellen (laufenden) oder vorherigen (geschlossenen) Balken - Überwachung von Signalen entsprechend dem aktuellen (offenen) Balken oder dem vorherigen (geschlossenen) Balken

very useful indicator