Multi Timeframe Indicator
- Indicadores
- Versión: 1.51
- Actualizado: 18 octubre 2020

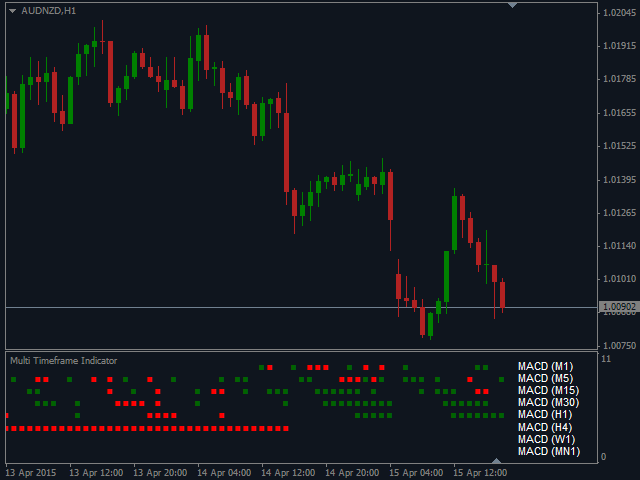
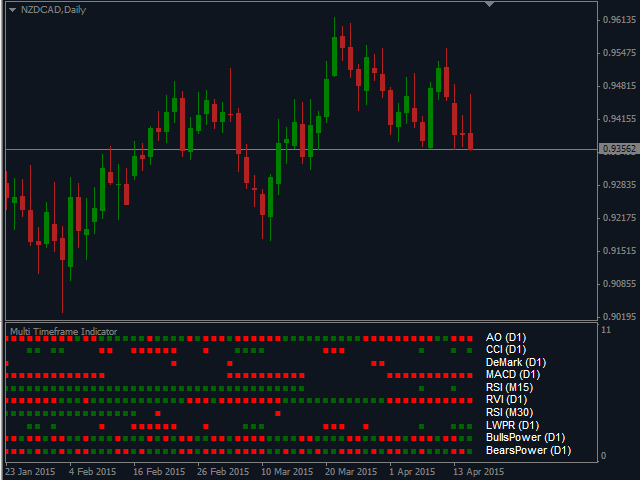
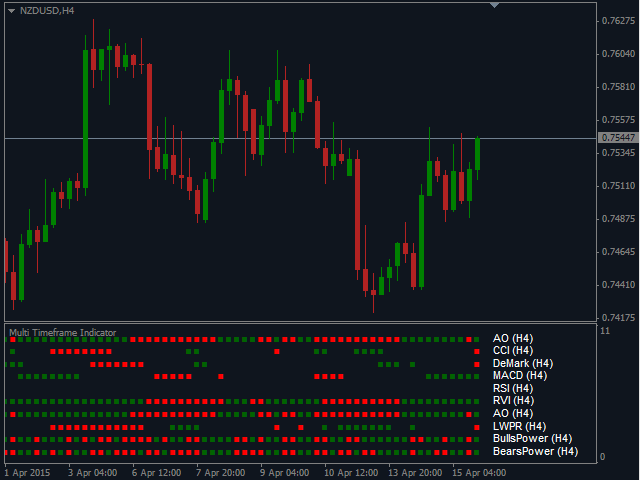
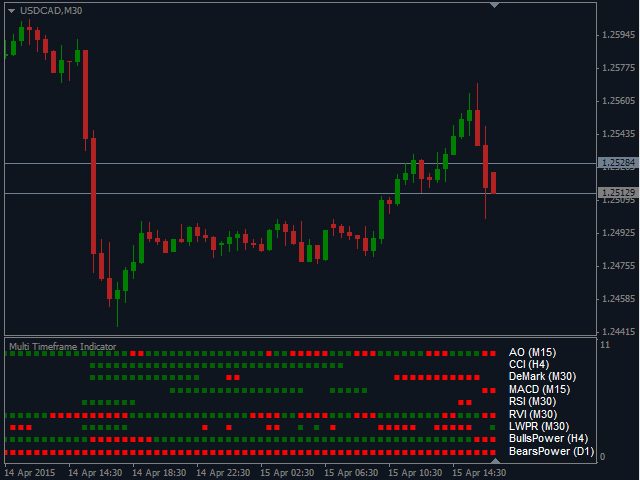
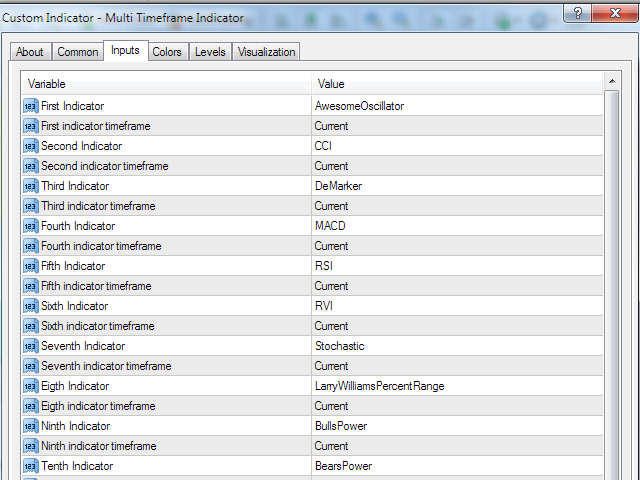
Multi Timeframe Indicator incluye una gran cantidad de funciones y puede ser considerado como un ayudante universal para un trader. Su principal objetivo es mostrar hasta 10 indicadores a la vez utilizando sólo un pequeño ladrillo por cada uno de ellos. Estos indicadores incluyen Awesome Oscillator, CCI, DeMarker, MACD, RSI, RVI, Estocástico, Larry Williams' Percent Range, Bulls Power y Bears Power. Una función importante del indicador es la capacidad de monitorizar señales de diferentes marcos temporales. Puede elegir diferentes combinaciones, incluyendo la visualización de diferentes marcos temporales de un indicador o varios marcos temporales de varios indicadores.
El enfoque de la visualización de ladrillos en diferentes marcos de tiempo se basa en la presencia de una señal en el momento de la apertura de una barra del marco de tiempo actual. Así que usted puede mirar a través de la historia y seleccionar los parámetros y un marco de tiempo de cada indicador para los mejores resultados - las señales no se redibujará.. Para mayor comodidad, el marco temporal que ha elegido en la configuración de visualización se especifica entre paréntesis junto al nombre del indicador en el gráfico. Si desea utilizar todos los indicadores sólo en el marco temporal del gráfico abierto en ese momento, sin utilizar la función de marco temporal múltiple, también puede seleccionar esa opción. También puede cambiar los colores por defecto y el tamaño de los ladrillos de compra y venta, así como el color del nombre del indicador y su marco temporal en los parámetros.
También es posible activar las notificaciones con varios ajustes.
Parámetros del indicador
- Primer indicador...Décimo indicador - seleccione del primer al décimo indicador
- Primer indicador timeframe...Décimo indicador timeframe - seleccionar timeframe para cada indicador
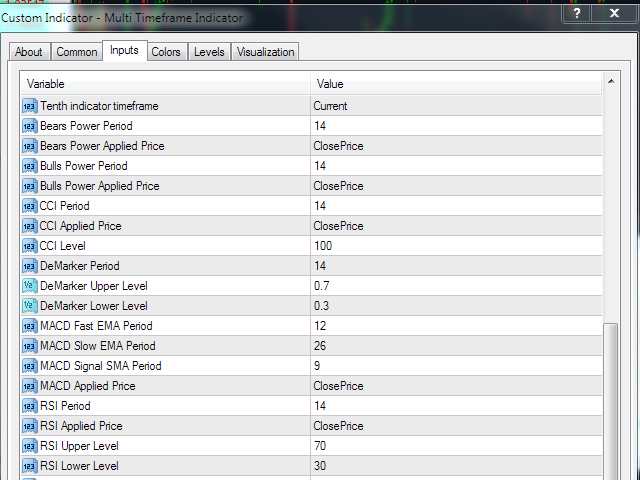
- Período Bears Power - período del indicador Bears Power
- BearsPower Applied Price - precio utilizado para el cálculo del indicador Bears Power
- Bulls Power Period - periodo del indicador Bulls Power
- Bulls Power AppliedPrice - precio utilizado para el cálculo del indicador Bulls Power
- CCIPeriod - periodo del indicador CCI
- CCIApplied Price - precio utilizado para el cálculo del indicador CCI
- CCI Level - nivel del indicador CCI. Una señal aparece después de cruzar este nivel. Este valor se introduce para el nivel superior. Para el nivel inferior se calcula automáticamente como negativo.
- Período DeMarker - período del indicador DeMarker
- DeMarkerUpper Level - nivel superior del indicador DeMarker. Una señal de venta aparece después de cruzar este nivel
- DeMarkerLower Level - Nivel inferior del indicador DeMarker. Una señal de compra aparece después de cruzar este nivel
- MACDFast EMA Period - periodo rápido EMA MACD
- MACD Slow EMA Period - periodo de la EMA lenta MACD
- MACD Signal SMA Period - periodo de señal SMA MACD
- MACDApplied Price - precio utilizado para el cálculo del indicador MACD
- RSI Period - periodo del indicador RSI
- RSI Applied Price - precio utilizado para el cálculo del indicador RSI
- RSI Upper Level - nivel superior del indicador RSI. Una señal de venta aparece después de cruzar este nivel
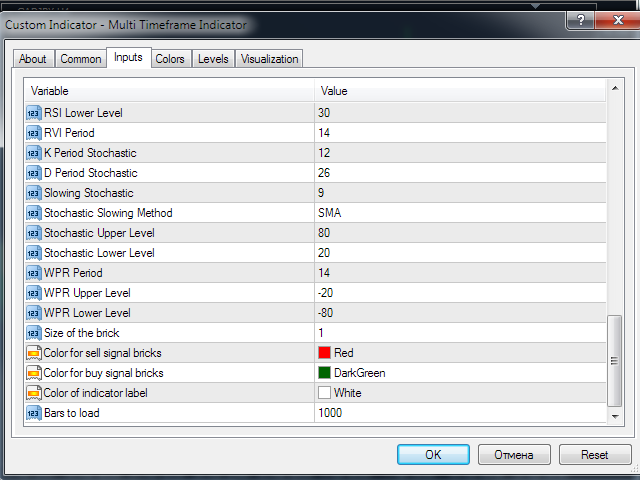
- RSI Lower Level - nivel inferior del indicador RSI. Una señal de compra aparece después de cruzar este nivel
- RVI Period - periodo del indicador RVI
- K Period Stochastic - periodo K del indicador Estocástico
- DPeriod Sto chastic - periodo D del indicador Estocástico
- Estocástico deralentización - período medio del indicador Estocástico
- StochasticSlowing Method - método de promediación del indicador Estocástico
- StochasticUpper Level - nivel superior del indicador Estocástico. Una señal de venta aparece después de cruzar este nivel
- StochasticLower Level - Nivel inferior del indicador Estocástico. Una señal de compra aparece después de cruzar este nivel
- Periodo WPR - periodo del Rango Porcentual de Larry Williams
- Nivel SuperiorWPR - nivel superior del Rango Porcentual de Larry Williams. Una señal de venta aparece después de cruzar este nivel
- WPR Lower Level - nivel inferior del rango porcentual de Larry Williams. Una señal de compra aparece después de cruzar este nivel
- Tamaño del ladrillo - tamaño de un ladrillo que muestra una señal
- Colorpara ladrillos de señal de venta - color del ladrillo de señal de venta
- Colorpara ladrillos de señal de compra - color del ladrillo de señal de compra
- Color de la etiqueta del indicador - color del nombre del indicador y un marco de tiempo
- Barras a cargar - número de barras para el cálculo
- Activar el alertador - alerta cuando se forma una señal
- Ladrillos del mismo color para alertar - número de ladrillos del mismo color para alertar
- Comprobar si hay señales en la barra actual(en curso) o en la anterior(cerrada) - controlar las señales según la barra actual (en curso ) o la anterior (cerrada)

very useful indicator