AdaptiveRSiMt5

3

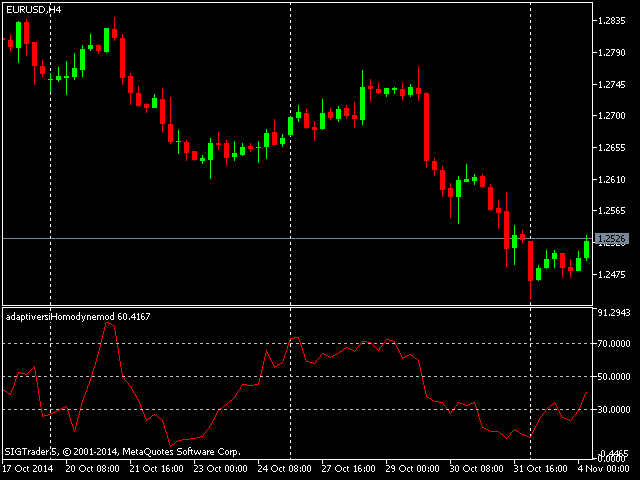
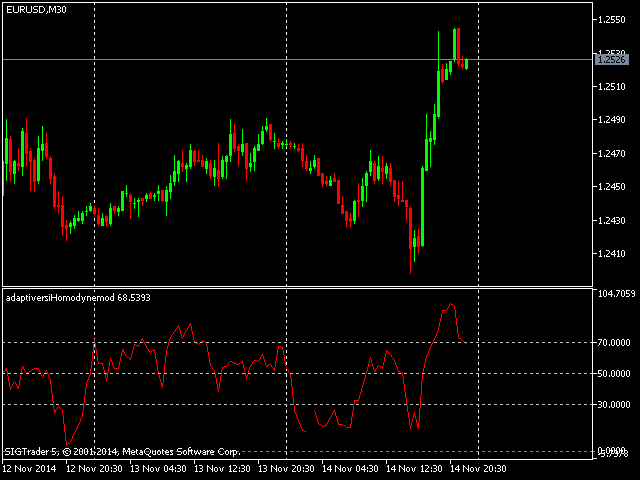
The Relative strength index is an oscillator that follows price, it was introduced by Welles Wilder, who went on to recommend the 14 period RSI. This adaptive version is based on the indicator described by John Ehlers, in the book 'Rocket Science for Traders'. The indicator uses the homodyne descriminator to compute the dominant cycle.

To apply the homodyne descriminator, real and imaginary parts have to be calculated from the Inphase and Quadrature components. (Inphase and Quadrature components are deduced using the Hilbert transform. To learn more about this, read the article on Advanced adaptive Indicators theory and implementation. The sections on Complex numbers and phasors for measuring market cycles and also Measuring cycle period.) To achieve this the product of the current Inphase component and its value a bar ago are added to the product of the current Quadrature component and its value one bar ago to produce the real part. For the imaginary part, the product of the current Quadrature component and the value of Inphase component a bar ago is taken away from the product of the current Inphase component and the value of the Quadrature component a bar ago. Both real and imaginary parts are then smoothed, before the cycle period can be deduced.

The cycle is calculated by taking the arctangent of the imaginary part divided by the real part. Restrictions are placed so as to make sure that the rate of change of the cycle period is limited to +-50% of the previous cycle period and further more, the resulting cycle period is limited to being greater than 6 and less than 50. Smoothing is then applied for the last time on the cycle period.

This cycle period value is then used at each bar close as the value that represents the number of bars back to be analyzed for producing the Relative strength indicator. This enables the adaptive nature of the indicator.

It  can be used as an alternative to the conventional Relative strength index. You do not need to worry about  setting periods.

Indicator Parameters:

  • The limits value controls the number bars the indicator will be drawn for.
  • The cyclepart is a modifier for the calculated cycle period, it helps to make sure that the indicator remains in phase with the price data. The figure can also be used to optimize the indicator for the measured cycle.
Prodotti consigliati
AdaptiveCCiMt5
Francis Dube
4 (2)
The Commodity Channel Index computes the deviation of the typical price of each bar from the average price over a particular time period. Multiplying the median deviation by 0.015 facilitates normalization, which makes all deviations below the first standard deviation less than  -100, and all deviations above the first standard deviation more than 100. This adaptive version is based on the indicator described by John Ehlers, in the book Rocket Science for traders. The indicator uses the homodyne
FREE
MWC COX 5
Joerg Hamann
3 (1)
The MWC COX indicator shows the extreme zones of net short/long positions of the Commitments of Traders Report released by the CFTC once a week for four periods of time. Default settings are periods of 12, 26, 52 and 156 weeks. Additional Features Displays the sum of all 4 periods in one line MA, MOM and RSI indicators are integrated ( not in the MQL5 Version 1.0 ) Please make sure that you download the MWC_Demo.zip file and unpack it into   [...]/MQL5/Files   folder.  ->  www.myweeklycot.com/t
FREE
Indicator MA Channel
Alexey Smirnov
4 (1)
I present the well-known Moving Average indicator. This indicator is presented as a channel, where the upper and lower lines are equidistant from the main line by a percentage set by the user. The indicator is easy to use. The basic settings of the moving average have been saved and a percentage parameter (Channel%) has been added. Basic parameters: Channel% - shows how much we want to deviate from the main line. The indicator is freely available.
FREE
VFI Quantum
Nikita Berdnikov
5 (1)
Introducing VFI (Volume Flow Indicator) – a trading indicator that analyzes the relationship between volume and price movement to identify key trading opportunities. The indicator displays the strength and direction of volume flow, providing clear signals about potential entry and exit points. Signals are formed based on zero line crossovers, crossovers between the VFI line and its exponential moving average (EMA), and when the indicator exits overbought and oversold zones. Attention! This stra
FREE
FractalEfficiencyIndicator   A ratio between 0 and 1 with the higher values representing a more efficient or trending market,  It is used in the calculation of Perry J. Kaufman Adaptive Moving Average (KAMA), dividing the price change over a period by the absolute sum of the price movements that occurred to achieve that change. The Fractal Efficiency or also known as Efficiency Ratio was first published by Perry J. Kaufman in his book   ‘Smarter Trading‘. This is mostly considered a filter for v
FREE
SuperTrend Indicator – Description & Important Notice The SuperTrend is a composite technical indicator designed to help you identify the primary trend, measure its strength, and assess signal quality. However, an indicator is only a tool —it’s never 100% accurate and cannot replace sound risk management. 1. Core Formula & Components ATR (Average True Range): measures price volatility; customize sensitivity via Periods and Multiplier . Upper/Lower Bands: derived from ATR and your chosen source p
FREE
An analogue of the Stochastic oscillator based on algorithms of singular spectrum analysis (SSA) SSA is an effective method to handle non-stationary time series with unknown internal structure. It is used for determining the main components (trend, seasonal and wave fluctuations), smoothing and noise reduction. The method allows finding previously unknown series periods and make forecasts on the basis of the detected periodic patterns. Indicator signals are identical to signals of the original i
FREE
Follow The Line MT5
Oliver Gideon Amofa Appiah
4.6 (35)
This indicator obeys the popular maxim that: "THE TREND IS YOUR FRIEND" It paints a GREEN line for BUY and also paints a RED line for SELL. (you can change the colors). It gives alarms and alerts of all kinds. IT DOES NOT REPAINT and can be used for all currency pairs and timeframes. Yes, as easy and simple as that. Even a newbie can use it to make great and reliable trades. NB: For best results, get my other premium indicators for more powerful and reliable signals. Get them here: https://www.m
FREE
ACI Bollinger Bands
Marat Sultanov
4 (3)
Tired of adjusting the indicator settings losing precious time? Tired of the uncertainty regarding their efficiency? Afraid of the uncertainty in their profitability? Then the indicator ACI (automatically calibrateable indicator) is designed exactly for you. Launching it, you can easily solve these three issues just performing the simplest action: clicking a single Calibrate button. To achieve the highest efficiency, you should perform another additional action: move the power slider to the maxi
FREE
Auto Fibonacci
Ali Gokay Duman
5 (3)
This indicator calculates fibonacci levels via moving averages trend and draw these lines. You can change fast and slow Moving Averages settings for customization. Inputs: Fast MA Time Period :  64 Fast MA Shift: 0 Fast MA Method: Smoothed Fast MA Apply To: Median Price Slow MA Time Period: 32 Slow MA Shift: 0 Slow MA Method: Smoothed Slow MA Apply To: Median Price ZigZag: False ZigZag Color: Red ZigZag Type: DashDot ZigZag Width: VeryThin Fibo Settings TrendFibonacci: True FiboTrendColor: Black
FREE
Returns MT5
Fabrizio Malavasi
This indicator shows the value of returns in the selected time frame They are calculated as logarithm of returns , rather than price or raw returns. For small returns, arithmetic and logarithmic returns will be similar. The benefit of using returns, versus prices, is normalization. It is possible measures all variables in a comparable metric despite originating from price series of unequal values Inputs You can display data both as a Histogram  or a   Line It's also possible to display  the a
FREE
A professional tool for trading - the divergence indicator between the RSI and the price, which allows you to receive a signal about a trend reversal in a timely manner or catch price pullback movements (depending on the settings). The indicator settings allow you to adjust the strength of the divergence due to the angle of the RSI peaks and the percentage change in price, which makes it possible to fine-tune the signal strength. The indicator code is optimized and is tested very quickly as par
FREE
Linear Momentum Pro
Sejro Toussaint Boco
Ultra Momentum — Advanced Multi-Scale Momentum & Market Pressure Indicator (MT5) Ultra Momentum is a professional momentum indicator for MetaTrader 5 , designed to measure true market speed and directional dominance rather than simple price oscillations. It combines classic Momentum with multi-period analysis and advanced smoothing algorithms , producing a highly reliable view of bullish and bearish pressure. This indicator is built for traders who want to understand who controls the market a
FREE
HighLow MT5
Azamat Mullayanov
4 (2)
The indicator plots two lines by High and Low prices. The lines comply with certain criteria. The blue line is for buy. The red one is for sell. The entry signal - the bar opens above\below the lines. The indicator works on all currency pairs and time frames It can be used either as a ready-made trading system or as an additional signal for a custom trading strategy. There are no input parameters. Like with any signal indicator, it is very difficult to use the product during flat movements. You
FREE
Mitimom
Danil Poletavkin
The indicator is based on Robert Miner's methodology described in his book "High probability trading strategies" and displays signals along with momentum of 2 timeframes. A Stochastic oscillator is used as a momentum indicator. The settings speak for themselves period_1 is the current timeframe, 'current' period_2 is indicated - the senior timeframe is 4 or 5 times larger than the current one. For example, if the current one is 5 minutes, then the older one will be 20 minutes The rest of the s
FREE
LT Force
Thiago Duarte
5 (5)
For those who like trend the Force will be a very useful indicator. This is because it is based on the famouse ADX, which measure the strenght of a trend, but without its 3 confusing lines. Force has its very simple interpretation: if the histogram is above zero level the trend is up, otherwise it is down. You can use it to find divergences too, which is very profitable. Thanks to Andre Sens for the version 1.1 idea. If you have any doubt or suggestion, please, contact me. Enjoy! MT4 version: 
FREE
"Driver Road Bands" indicator that is designed to be used in the 1H, 4H and 1D timeframes in the most ideal way. If we compare timeframes to roads and streets; main streets and highways with high traffic volume are similar to high-time timeframes in technical analysis. If you can interpret the curvilinear and linear lines drawn by this indicator on the graphic screen with your geometric perspective and develop your own buy and sell strategies; you may have the key to being a successful trader.
FREE
Full Description  Liquidity Hunt Candle Color Indicator is a Smart Money Concept (SMC) based MT5 indicator designed to detect stop hunts and liquidity sweeps in the market. Instead of using arrows or objects, this indicator directly colors the candles for a clean and professional chart appearance. How It Works The indicator identifies liquidity hunts using the following logic: Sell Liquidity Hunt (Buy-Side Liquidity Sweep) Current candle breaks the highest high of previous N candles Can
FREE
Coral Indi
Dinh Duong Luong
Coral trend is   a trend-following indicator that is widely popular among FOREX traders . It is usually used as a confluence with other indicators. It uses combinations of moving averages with complex smoothing formulas! It has two configurable parameters: Coefficient   - smoothing ratio (*) Applied price Calculation: Coral = (-0.064) * B6 + 0.672 * B5 - 2.352 * B4 + 2.744 * B3
FREE
TSO Stochastic RSI MT5
Dionisis Nikolopoulos
4.5 (2)
Stochastic RSI makes a stochastic calculation on the RSI indicator. The Relative Strength Index (RSI) is a well known momentum oscillator that measures the speed and change of price movements, developed by J. Welles Wilder. Features Find overbought and oversold situations. Sound alert when overbought/oversold level is reached. Get email and/or push notification alerts when a signal is detected. The indicator is non-repainting. Returns buffer values for %K and %D to be used as part of an EA. (se
FREE
Daily High Low Danilo Monteiro
Danilo Hudson Couto Monteiro
# Indicador Daily High - Danilo Monteiro - MT5 ## Descrição O Daily High/Low Labels é um indicador personalizado para MetaTrader 5 que exibe automaticamente as máximas e mínimas diárias no gráfico, facilitando a identificação rápida dos níveis importantes de preço. O indicador marca os preços com etiquetas e linhas horizontais, permitindo uma visualização clara dos níveis críticos do dia atual e anterior. ## Principais Características ### 1. Marcação Automática - Exibe automaticamente as máxi
FREE
Super Trend eu
Emin Ulucanli
4.83 (6)
SUPERTREND; È un indicatore di trend following basato sull'ATR SuperTrend creato da Olivier Seban. Può essere utilizzato per rilevare i cambiamenti nella direzione del trend e individuare gli arresti. Quando il prezzo scende al di sotto della curva dell'indicatore, diventa rosso e indica una tendenza al ribasso. Al contrario, quando il prezzo si sposta al di sopra della curva, l'indicatore diventa verde, indicando un trend rialzista. Come altri indicatori, funziona bene su SuperTrend se utilizza
FREE
RSI magic kjuta trial is the demo version of RSI magic kjuta. Custom Indicator (RSI magic kjuta) based on the standard   (Relative Strength Index, RSI) with additional settings and functions. The maximum and minimum RSI lines on the chart have been added to the standard RSI line. Now you can visually observe the past highs and lows of RSI, and not only the values of the closing bars, which avoids confusion in the analysis of trades. For example, the EA opened or closed an order, but the RSI li
FREE
SSACD - Singular Spectrum Average Convergence/Divergence This is an analogue of the MACD indicator based on the Caterpillar-SSA ( Singular Spectrum Analysis ) method. Limited version of the SSACD Forecast indicator. Limitations include the set of parameters and their range. Specificity of the method The Caterpillar-SSA is an effective method to handle non-stationary time series with unknown internal structure. The method allows to find the previously unknown periodicities of the series and make
FREE
Ultimate MACD MTF Pro è una versione potente e aggiornata del classico MACD, riprogettata per il trading moderno. Questo indicatore offre MACD Multi-Timeframe (MTF), colori dinamici dell'istogramma, marcatori di segnale incrociato e cambi intelligenti di colore della linea basati sul momentum. Costruito per i trader che desiderano segnali puliti, rilevamento precoce del trend e chiarezza visiva di livello professionale. Caratteristiche Chiave MACD Multi-Timeframe (MTF) Passa facilmente dal
FREE
Indicatore Heiken Ashi Smoothed per MT5 Heiken Ashi avanzato con filtro di smoothing. Riduce il rumore, elimina falsi segnali e individua trend precocemente. Ideale per Forex, indici e crypto (H1-D1). Come funziona e come viene levigato? L'Heiken Ashi tradizionale calcola le candele mediando i valori di apertura, chiusura, massimo e minimo dei periodi precedenti, riducendo già l'impatto delle fluttuazioni minori. Tuttavia, l' Heiken Ashi Smoothed eleva questo approccio applicando un filtro di le
FREE
The RSI with Moving Averages indicator combines the classic Relative Strength Index with customizable moving averages, offering deeper insights into market momentum and trend direction. By smoothing the RSI curve with short- and long-term averages, traders can better distinguish true reversals from noise. This tool highlights overbought and oversold levels, reveals divergences between price and momentum, and confirms entry or exit points with enhanced accuracy. Its adjustable parameters allow tr
FREE
VoidSignal Phase Splitter
Pieter Gerhardus Van Zyl
Check out my German Pro Signal -  https://www.mql5.com/en/signals/2354346 VoidSignal Phase Splitter is a compact market-flow interpreter designed to highlight when price transitions into positive or negative momentum states. Instead of showing raw moving-average data or traditional oscillation, it projects a “phase prism” view: a simplified binary histogram that lights up green for upward flow (+Phase) and pink for downward flow (–Phase). The indicator continuously evaluates how price pressure
Cross MA histogram
Mariusz Piotr Rodacki
The Cossover MA Histogram indicator is a simple tool showing the trend based on crossover of moving averages. Simply specify two mobving averages and addicional parameters like MA method and Applied price. When fast MA is above slow MA the histogram is green, indicating an uptrend. When MA fast is below MA slow the histogram is red, indicating an downtrend.
FREE
Ritz Candle Maximus
Syamsurizal Dimjati
Candle MAXIMUS RITZ Candle MAXIMUS adalah indikator visual cerdas yang menggabungkan kekuatan analisis tren berbasis Kaufman Adaptive Moving Average (KAMA) , informasi perubahan harian (Daily Change), perbandingan OHLC terhadap hari sebelumnya, serta panel dominasi bar multi-hari. Dirancang untuk semua pair dan semua timeframe, indikator ini menghadirkan tampilan modern, bersih, serta informatif dalam satu panel kompak di chart Anda. Fitur Utama Trend Candle Warna Adaptif (Color Candles) Warna
FREE
Gli utenti di questo prodotto hanno anche acquistato
SuperScalp Pro
Van Minh Nguyen
5 (14)
SuperScalp Pro – Sistema avanzato di indicatore per scalping con filtri multipli SuperScalp Pro è un sistema avanzato di indicatore per scalping che combina il classico Supertrend con molteplici filtri di conferma intelligenti. L’indicatore funziona in modo efficiente su tutti i timeframe da M1 a H4 ed è particolarmente adatto per XAUUSD, BTCUSD e le principali coppie Forex. Può essere utilizzato come sistema stand-alone o integrato in modo flessibile nelle strategie di trading esistenti. L’indi
Azimuth Pro
Ottaviano De Cicco
5 (6)
LAUNCH PROMO Azimuth Pro price is initially set at 299$ for the first 100 buyers. Final price will be 499$ . THE DIFFERENCE BETWEEN RETAIL AND INSTITUTIONAL ENTRIES ISN'T THE INDICATOR — IT'S THE LOCATION. Most traders enter at arbitrary price levels, chasing momentum or reacting to lagging signals. Institutions wait for price to reach structured levels where supply and demand actually shift. Azimuth Pro maps these levels automatically: swing-anchored VWAP, multi-timeframe structure lines, an
Divergence Bomber
Ihor Otkydach
4.9 (86)
Ogni acquirente dell’indicatore riceverà inoltre gratuitamente: L’utilità esclusiva “Bomber Utility”, che gestisce automaticamente ogni operazione, imposta i livelli di Stop Loss e Take Profit e chiude le posizioni secondo le regole della strategia I file di configurazione (set file) per adattare l’indicatore a diversi asset I set file per configurare il Bomber Utility in tre modalità: “Rischio Minimo”, “Rischio Bilanciato” e “Strategia di Attesa” Una guida video passo-passo per installare, conf
Entry In The Zone and SMC Multi Timeframe is a real-time market analysis tool developed based on Smart Money Concepts (SMC). It is designed to analyze market structure, price direction, reversal points, and key zones across multiple timeframes in a systematic way. The system displays Points of Interest (POI) and real-time No Repaint signals, with instant alerts when price reaches key zones or when signals occur within those zones. It functions as both an Indicator and a Signal System (2-in-1), c
RelicusRoad Pro: Sistema Operativo Quantitativo di Mercato 70% DI SCONTO ACCESSO A VITA (TEMPO LIMITATO) - UNISCITI A 2.000+ TRADER Perché la maggior parte dei trader fallisce anche con indicatori "perfetti"? Perché operano su Singoli Concetti isolati. Un segnale senza contesto è una scommessa. Per vincere serve CONFLUENZA . RelicusRoad Pro non è un semplice indicatore. È un Ecosistema Quantitativo completo . Mappa la "Fair Value Road", distinguendo tra rumore e rotture strutturali. Smetti di in
CGE Trading Suite
Carl Gustav Johan Ekstrom
5 (1)
CGE Trading Suite delivers the analytical edge typically reserved for professional trading desks. The platform integrates a full suite of analytical tools into one seamless workflow: dynamic grid mapping, liquidity behavior analysis, ECM, trend lines, MIDAS, trade cycles, and directional channel projections. Together, these provide a unified view of market structure and momentum. Directional clarity is further enhanced by the capital flow index, which measures currency basket strength to identif
Se acquisti questo indicatore, riceverai il mio Trade Manager Professionale + EA  GRATUITAMENTE. Innanzitutto è importante sottolineare che questo sistema di trading è un indicatore Non-Repainting, Non-Redrawing e Non-Lagging, il che lo rende ideale sia per il trading manuale che per quello automatico. Corso online, manuale e download di preset. Il "Sistema di Trading Smart Trend MT5" è una soluzione completa pensata sia per i trader principianti che per quelli esperti. Combina oltre 10 indicat
Gold Entry Sniper
Tahir Mehmood
5 (6)
Gold Entry Sniper – Dashboard ATR Multi-Timeframe per Scalping e Swing Trading sull’Oro Gold Entry Sniper è un indicatore avanzato per MetaTrader 5 che offre segnali di acquisto/vendita precisi per XAUUSD e altri strumenti, basato sulla logica ATR Trailing Stop e l' analisi multi-timeframe . Caratteristiche e Vantaggi Analisi Multi-Timeframe – Visualizza trend su M1, M5, M15 in un'unica dashboard. Trailing Stop Basato su ATR – Stop dinamici che si adattano alla volatilità. Dashboard Professional
FX Trend MT5 NG
Daniel Stein
5 (4)
FX Trend NG: La Nuova Generazione di Intelligenza di Trend Multi-Mercato Panoramica FX Trend NG è uno strumento professionale di analisi del trend multi-timeframe e monitoraggio dei mercati. Ti consente di comprendere la struttura completa del mercato in pochi secondi. Invece di passare tra numerosi grafici, puoi identificare immediatamente quali strumenti sono in trend, dove il momentum sta diminuendo e dove esiste un forte allineamento tra i timeframe. Offerta di Lancio – Ottieni FX Trend NG
Power Candles MT5
Daniel Stein
5 (6)
Power Candles – Segnali di ingresso basati sulla forza per tutti i mercati Power Candles porta l’analisi di forza collaudata di Stein Investments direttamente sul grafico dei prezzi. Invece di reagire solo al prezzo, ogni candela viene colorata in base alla reale forza di mercato, consentendo di identificare immediatamente accumuli di momentum, accelerazioni della forza e transizioni di trend pulite. Un’unica logica per tutti i mercati Power Candles funziona automaticamente su tutti i simboli di
Meridian Pro
Ottaviano De Cicco
5 (1)
Meridian Pro: Professional Multi-Timeframe Trend Matrix for MT5 Overview Meridian Pro is a multi-timeframe trend matrix by Merkava Labs that compresses directional state, strength, momentum condition and matrix agreement into one compact panel. One adaptive engine, applied consistently from M1 to W1. No per-symbol tuning. No indicator stacking. One structured readout across every asset and every timeframe. Launch Offer — Get Meridian Pro for USD 99 (introductory). Regular price: USD 149. 1. Why
Trend Screener Pro MT5
STE S.S.COMPANY
4.84 (103)
Indicatore di tendenza, soluzione unica rivoluzionaria per il trading di tendenze e il filtraggio con tutte le importanti funzionalità di tendenza integrate in un unico strumento! È un indicatore multi-timeframe e multi-valuta al 100% non ridipingibile che può essere utilizzato su tutti i simboli/strumenti: forex, materie prime, criptovalute, indici e azioni. Trend Screener è un indicatore di tendenza che segue un indicatore efficiente che fornisce segnali di tendenza a freccia con punti nel gra
[ My Products ] , [ My Channel ]   ,  [ LIVE SIGNAL ] HFT Spike Detector HFT Spike Detector è uno strumento professionale di monitoraggio dei tick progettato per analizzare e misurare in tempo reale i movimenti di prezzo ad alta frequenza (picchi improvvisi causati da HFT). Il suo scopo è permetterti di rilevare slippage anomalo, gap di liquidità e picchi di prezzo a livello millisecondo causati dal broker, utilizzando dati numerici. Poiché analizza il flusso di tick in tempo reale e le cond
Atomic Analyst MT5
Issam Kassas
3.94 (31)
Innanzitutto, vale la pena sottolineare che questo indicatore di trading non è repaint, non è ridisegno e non presenta ritardi, il che lo rende ideale sia per il trading manuale che per quello automatico. Manuale utente: impostazioni, input e strategia. L'Analista Atomico è un indicatore di azione del prezzo PA che utilizza la forza e il momentum del prezzo per trovare un miglior vantaggio sul mercato. Dotato di filtri avanzati che aiutano a rimuovere rumori e segnali falsi, e aumentare il pote
Strumento per market maker. Meravith: Analizzerà tutti i timeframe e mostrerà il trend attualmente in corso. Evidenzierà le zone di liquidità (equilibrio dei volumi) dove i volumi rialzisti e ribassisti sono uguali. Mostrerà tutti i livelli di liquidità dei diversi timeframe direttamente sul grafico. Genererà e presenterà un’analisi di mercato testuale a scopo di riferimento. Calcolerà obiettivi, livelli di supporto e punti di stop-loss in base al trend attuale. Calcolerà il rapporto rischio/ren
OmniSync Projection
Antonio-alin Teculescu
5 (1)
Chronos Fractal Engine is an innovative price projection indicator for MetaTrader 5, designed to transform your technical analysis by intelligently identifying and projecting historical price patterns. Built upon an advanced correlation algorithm and the fractal principles of the market, this powerful tool visualizes potential future price movements, giving you a unique edge in your trading decisions. What is Chronos Fractal Engine? At its core, the Chronos Fractal Engine employs a sophisticat
ARICoins
Temirlan Kdyrkhan
ARICoin is a powerful trading companion designed to generate high-probability entry signals with dynamic TP/SL/DP levels based on volatility. Built-in performance tracking shows win/loss stats, PP1/PP2 hits, and success rates all updated live. Key Features: Buy/Sell signals with adaptive volatility bands Real-time TP/SL/DP levels based on ATR Built-in MA Filter with optional ATR/StdDev volatility Performance stats panel (Success, Profit/Loss, PP1/PP2) Alerts via popup, sound, push, or email Cust
Quantum TrendPulse
Bogdan Ion Puscasu
5 (22)
Ecco   Quantum TrendPulse   , lo strumento di trading definitivo che combina la potenza di   SuperTrend   ,   RSI   e   Stocastico   in un unico indicatore completo per massimizzare il tuo potenziale di trading. Progettato per i trader che cercano precisione ed efficienza, questo indicatore ti aiuta a identificare con sicurezza le tendenze di mercato, i cambiamenti di momentum e i punti di entrata e uscita ottimali. Caratteristiche principali: Integrazione SuperTrend:   segui facilmente l'andame
Currency Strength Dashboard Pro Pannello professionale di analisi della forza delle valute in tempo reale per MetaTrader 5 . L’indicatore calcola e visualizza la forza di 8 valute principali (EUR, USD, GBP, JPY, CHF, AUD, CAD, NZD) utilizzando 28 coppie di valute simultaneamente su più timeframe. Il pannello offre al trader una visione completa del mercato a colpo d’occhio — senza calcoli aggiuntivi né la necessità di passare tra diversi grafici. Metodo di calcolo L’indicatore si basa su un meto
Grabber System MT5
Ihor Otkydach
4.83 (23)
Ti presento un eccellente indicatore tecnico: Grabber, che funziona come una strategia di trading "tutto incluso", pronta all’uso. In un solo codice sono integrati strumenti potenti per l’analisi tecnica del mercato, segnali di trading (frecce), funzioni di allerta e notifiche push. Ogni acquirente di questo indicatore riceve anche gratuitamente: L’utility Grabber: per la gestione automatica degli ordini aperti Video tutorial passo dopo passo: per imparare a installare, configurare e utilizzare
Presentazione       Quantum Breakout PRO   , l'innovativo indicatore MQL5 che sta trasformando il modo in cui scambi le zone di breakout! Sviluppato da un team di trader esperti con un'esperienza di trading di oltre 13 anni,       Quantum Breakout PRO       è progettato per spingere il tuo viaggio di trading a nuovi livelli con la sua strategia innovativa e dinamica della zona di breakout. Quantum Breakout Indicator ti fornirà frecce di segnalazione sulle zone di breakout con 5 zone target di
FX Power MT5 NG
Daniel Stein
5 (31)
FX Power: Analizza la Forza delle Valute per Decisioni di Trading Più Intelligenti Panoramica FX Power è lo strumento essenziale per comprendere la reale forza delle principali valute e dell'oro in qualsiasi condizione di mercato. Identificando le valute forti da comprare e quelle deboli da vendere, FX Power semplifica le decisioni di trading e rivela opportunità ad alta probabilità. Che tu segua le tendenze o anticipi inversioni utilizzando valori estremi di Delta, questo strumento si adatta
Bill Williams Advanced
Siarhei Vashchylka
5 (11)
Bill Williams Advanced is designed for automatic chart analysis using Bill Williams' "Profitunity" system. The indicator analyzes four timeframes at once. Manual (Be sure to read before purchasing) Advantages 1. Analyzes the chart using Bill Williams' "Profitunity" system. Signals are displayed in a table in the corner of the screen and on the price chart. 2. Finds all known AO and AC signals, as well as zone signals. Equipped with a trend filter based on the Alligator. 3. Finds "Divergence Bar
Advanced Supply Demand MT5
Bernhard Schweigert
4.53 (15)
La migliore soluzione per qualsiasi principiante o trader esperto! Questo indicatore è uno strumento di trading unico, di alta qualità e conveniente perché abbiamo incorporato una serie di funzionalità proprietarie e una nuova formula. Con questo aggiornamento, sarai in grado di mostrare fusi orari doppi. Non solo potrai mostrare una TF più alta, ma anche entrambe, la TF del grafico, PIÙ la TF più alta: SHOWING NESTED ZONES. Tutti i trader di domanda di offerta lo adoreranno. :) Informazioni imp
RFI levels PRO MT5
Roman Podpora
3.67 (3)
L'indicatore mostra accuratamente i punti di inversione e le zone di ritorno dei prezzi in cui il       Principali attori   . Vedi dove si formano le nuove tendenze e prendi decisioni con la massima precisione, mantenendo il controllo su ogni operazione. VERSION MT4     -    Rivela il suo massimo potenziale se combinato con l'indicatore   TREND LINES PRO Cosa mostra l'indicatore: Strutture di inversione e livelli di inversione con attivazione all'inizio di un nuovo trend. Visualizzazione dei li
Market Structure Order Block Dashboard MT5 è un indicatore per MT5 focalizzato sulla struttura di mercato e sui concetti ICT / Smart Money: HH/HL/LH/LL , BOS , ChoCH , oltre a Order Blocks , Fair Value Gaps (FVG) , liquidità (EQH/EQL, sweeps), sessioni / Kill Zones e un Volume Profile integrato, con una dashboard compatta di confluence. Importante: è uno strumento di analisi . Non esegue operazioni (non è un EA). Bonus per gli acquirenti Dopo l’acquisto, puoi ricevere 2 indicatori bonus (a scel
Market Structure Patterns
Samuel Manoel De Souza
4.47 (19)
Disponibile per   MT4   e   MT5 . Unisciti al canale Market Structure Patterns per scaricare materiale di studio e/o informazioni aggiuntive. Pubblicazioni correlate: Market Structure Patterns - Introdução Beyond Fancy Order Blocks: Using True Volumetric Analysis with Market Structure Patterns & Timeless Charts Market Structure Patterns   è un indicatore basato sui   Smart Money Concepts   che mostra gli   elementi SMC/ICT   che possono portare le tue decisioni di trading a un livello superior
Crystal Heikin Ashi Signals
Muhammad Jawad Shabir
5 (1)
Crystal Heikin Ashi Signals - Professional Trend & Signal Detection Indicator Advanced Heikin Ashi Visualization with Intelligent Signal System for Manual & Automated Trading Final Price: $149 ---------> Price goes up $10 after every 10 sales . Limited slots available — act fast . Overview Crystal Heikin Ashi Signals is a professional-grade MetaTrader 5 indicator that combines pure Heikin Ashi candle visualization with an advanced momentum-shift detection system. Designed for both manual traders
Scopri quale strategia funziona davvero sul tuo simbolo - prima di rischiare denaro reale. Power Bar rileva le barre di prezzo estreme su qualsiasi simbolo e qualsiasi timeframe, poi esegue istantaneamente il backtest di 3 diverse strategie di trading per confrontare tassi di vincita, fattori di profitto e P&L fianco a fianco. Tutto in un unico pannello interattivo. Niente supposizioni. Niente curve-fitting. Solo dati. Cosa rende Power Bar unico? La maggior parte degli indicatori fornisce un se
Smart Stop Indicator – Precisione intelligente dello stop-loss direttamente sul grafico Panoramica Smart Stop Indicator è la soluzione ideale per i trader che desiderano posizionare il loro stop-loss in modo chiaro e metodico, senza dover indovinare o affidarsi all’intuizione. Questo strumento combina la logica classica del price action (massimi e minimi strutturali) con un moderno riconoscimento dei breakout per identificare il prossimo livello di stop realmente logico. In trend, in range o i
Altri dall’autore
Curver Arrows
Francis Dube
3.75 (4)
This indicator is a straight port of a well known MetaTrader 4 indicator that is freely available on the Internet. It does not redraw at all. It implements a type of breakout strategy. The arrows indicate market direction. Use the indicator on M15 charts and higher. The indicator draws two bands near price action and generates signals when the price closes below the lower band and also above the upper band. The indicator uses periodic highs and lows to calculate upper and lower threshold bands.
FREE
AdaptiveCCiMt5
Francis Dube
4 (2)
The Commodity Channel Index computes the deviation of the typical price of each bar from the average price over a particular time period. Multiplying the median deviation by 0.015 facilitates normalization, which makes all deviations below the first standard deviation less than  -100, and all deviations above the first standard deviation more than 100. This adaptive version is based on the indicator described by John Ehlers, in the book Rocket Science for traders. The indicator uses the homodyne
FREE
Bollinger Bands Technical Indicator (BB) is similar to envelopes. The only difference is that the bands of Envelopes are plotted a fixed distance (%) away from the moving average, while the Bollinger Bands are plotted a certain number of standard deviations away from it. Standard deviation is a measure of volatility, therefore Bollinger Bands adjust themselves to the market conditions. When the markets become more volatile, the bands widen and they contract during less volatile periods. This ada
FREE
Filtro:
cham
884
cham 2025.11.03 15:11 
 

для меня слишком заумно . Да и перерисовывается скорее .Правда не проверял

[Eliminato] 2019.01.14 08:13 
 

L'utente non ha lasciato alcun commento sulla valutazione.

Gennadiy Voltornist
11909
Gennadiy Voltornist 2018.01.18 16:38 
 

L'utente non ha lasciato alcun commento sulla valutazione.

Daniel Andrejczuk
5597
Daniel Andrejczuk 2017.11.09 14:25 
 

L'utente non ha lasciato alcun commento sulla valutazione.

Rodrigo da Silva Boa
7137
Rodrigo da Silva Boa 2016.03.12 21:34 
 

L'utente non ha lasciato alcun commento sulla valutazione.

Rispondi alla recensione