Candlestick Patterns Scanner
- Indikatoren
- Version: 1.0
- Aktivierungen: 5
Please leave 5 Stars to me
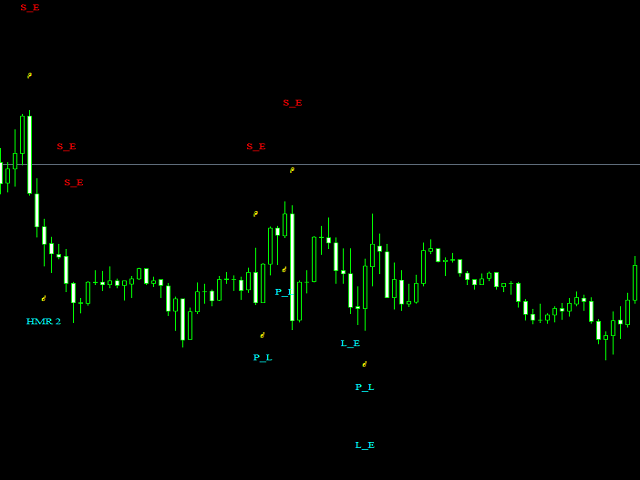
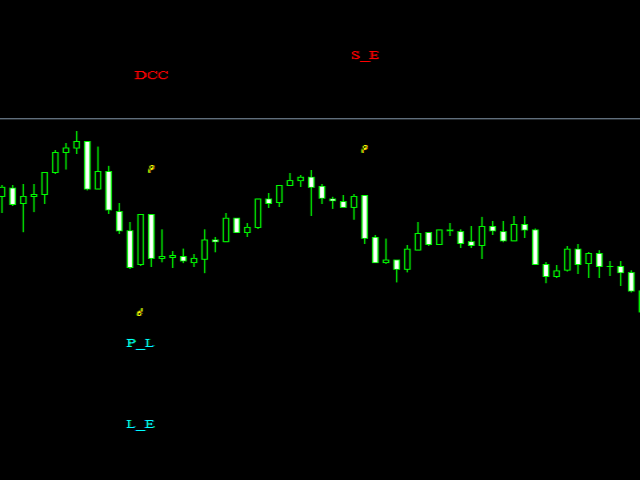
Candlestick Patterns Scanner ist ein professioneller Indikator, der Sie bei der Erkennung von Candlestick-Mustern auf meta trader 4 Charts unterstützt und Sie warnt, sobald ein Muster auf dem Chart erscheint.
In dertechnischen Finanzanalyse ist einCandlestick-Mustereine Kursbewegung, die grafisch in einemCandlestick-Chartdargestellt wird und von der manche glauben, dass sie eine bestimmte Marktbewegung vorhersagen kann. Die Erkennung des Musters ist subjektiv, und Programme, die zur Erstellung von Charts verwendet werden, müssen sich auf vordefinierte Regeln stützen, um das Muster zu erkennen.Candlesticks sind grafische Darstellungen von Kursbewegungen in einem bestimmten Zeitraum. Sie werden in der Regel durch die Eröffnungs-, Höchst-, Tiefst- und Schlusskurse eines Finanzinstruments gebildet.
Wenn der Eröffnungskurs über dem Schlusskurs liegt, wird eine gefüllte (normalerweise rote oder schwarze) Kerze gezeichnet.
Liegt der Schlusskurs über dem Eröffnungskurs, wird normalerweise eine grüne oder hohle Kerze (weiß mit schwarzem Umriss) angezeigt.
Der gefüllte oder hohle Teil der Kerze wird als Körper oderechter Körper bezeichnet und kann lang, normal oder kurz sein, je nach seinem Verhältnis zu den Linien darüber oder darunter.
Die Linien darüber und darunter, die alsSchatten,Schwänze oderDochte bezeichnet werden, stellen die Höchst- und Tiefstkurse innerhalb eines bestimmten Zeitraums dar. Allerdings haben nicht alle Kerzenständer Schatten.
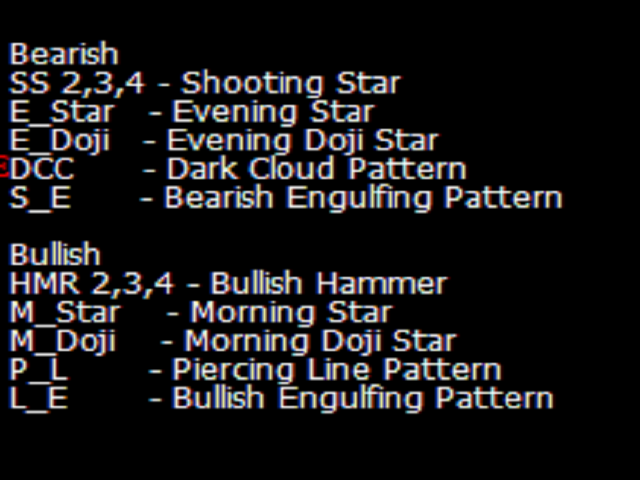
Der Candlestick-Muster-Scanner enthält viele Muster, darunter auch die folgenden.
BÄRISCH
- SHOOTING STAR
- ABNEHMENDER STERN
- DUNKLE WOLKENMUSTER
- BAISSE-ENGULFING-MUSTER
- DOJI
BULLISH
- BULLISH HAMMER
- MORGENSTERN
- MORGENSTERN
- PERICING-LINE-MUSTER
- BULLISH ENGLUFING PATTER
- DOJI
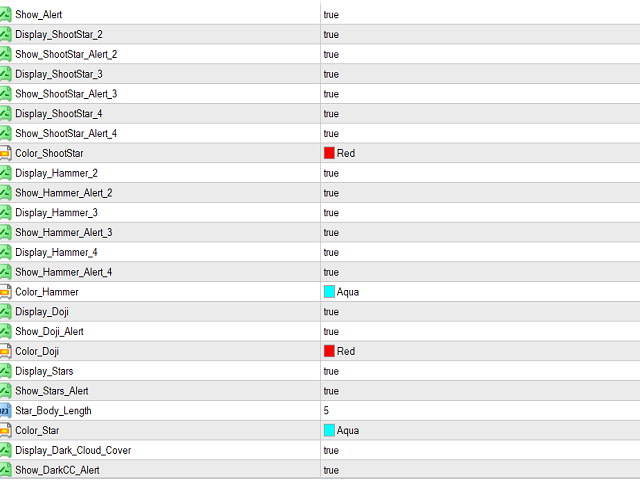
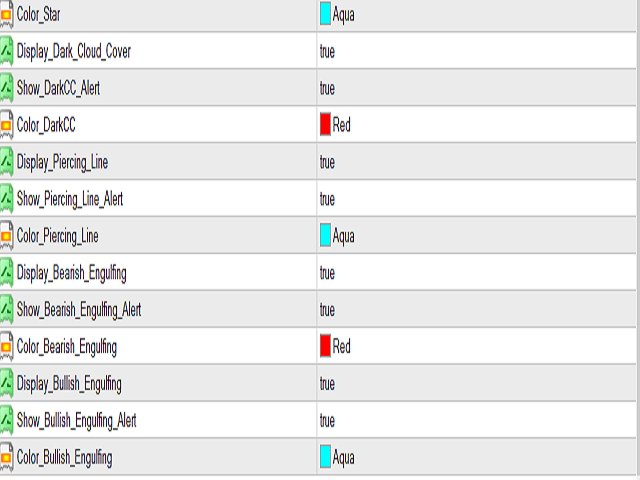
Sie können jedes beliebige Muster über das Eingabemenü ein- und ausschalten.
Indikator funktioniert auf allen Zeitrahmen.


Der Benutzer hat keinen Kommentar hinterlassen