Alligator Scanner MT5
- Indikatoren
- Version: 3.0
- Aktivierungen: 5

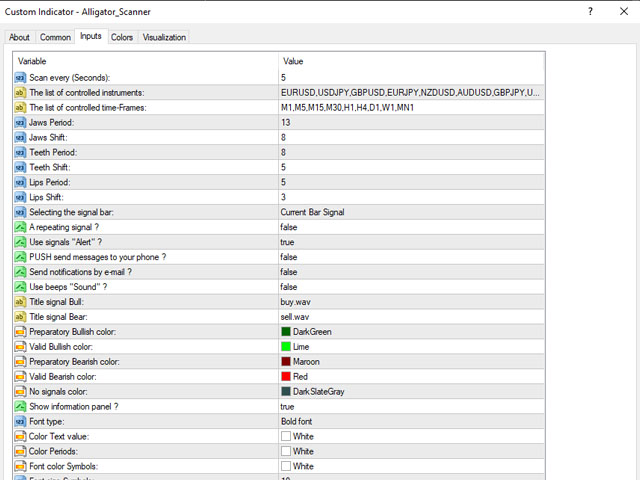
Der Alligator-Indikator verwendet drei geglättete gleitende Durchschnitte, die auf fünf, acht und 13 Perioden festgelegt sind und alle Fibonacci-Zahlen darstellen. Der erste geglättete Durchschnitt wird mit einem einfachen gleitenden Durchschnitt (SMA) berechnet, wobei zusätzliche geglättete Durchschnitte hinzugefügt werden, die die Drehungen des Indikators verlangsamen.
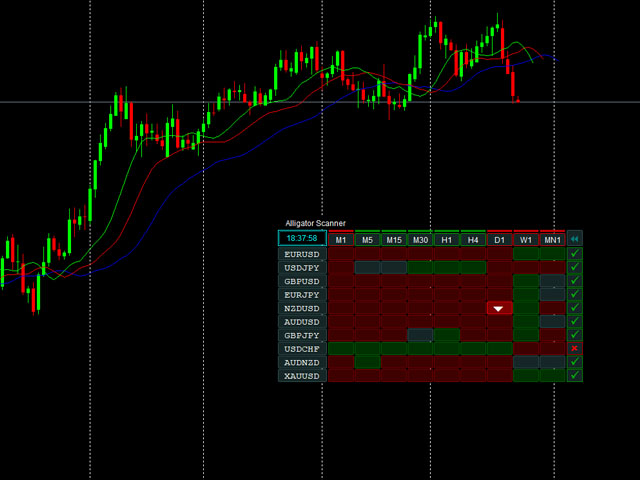
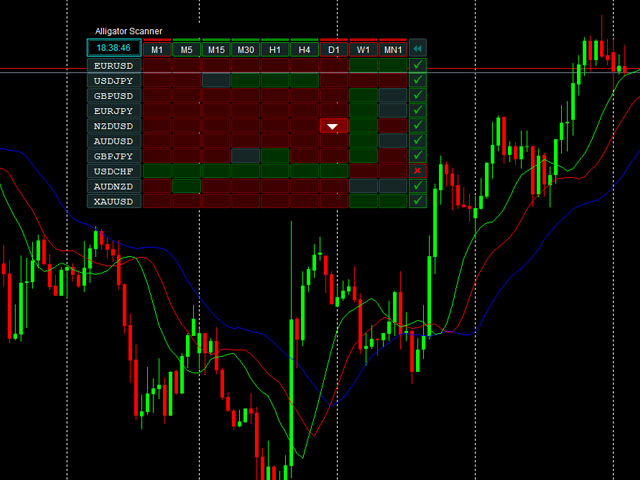
Scannen Sie alle Ihre Lieblingspaare mit Alligator und lassen Sie sich zu den von Ihnen bevorzugten Zeitrahmen benachrichtigen.
Die Einstellungen sind anpassbar
Klicken Sie auf den Zeitrahmen, um ihn zu ändern oder neue Paare zu öffnen
Benachrichtigung: Telefon/Popup/Email