Alligator Scanner MT5

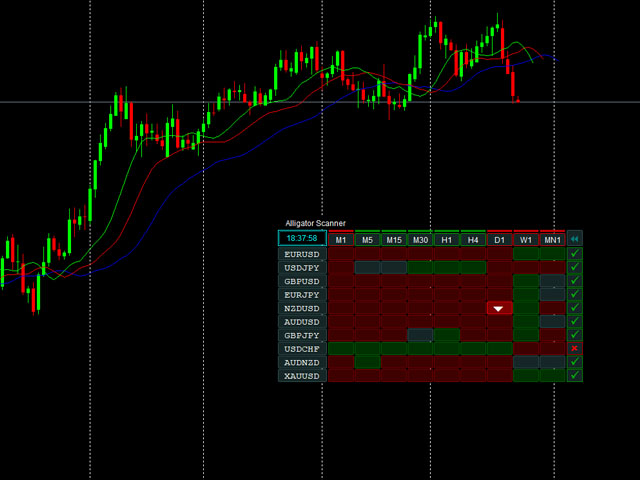
The Alligator indicator uses three smoothed moving averages, set at five, eight, and 13 periods, which are all Fibonacci numbers. The initial smoothed average is calculated with a simple moving average (SMA), adding additional smoothed averages that slow down indicator turns.

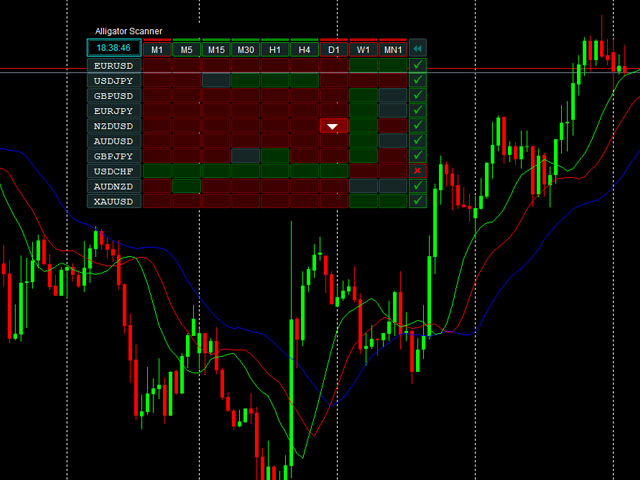
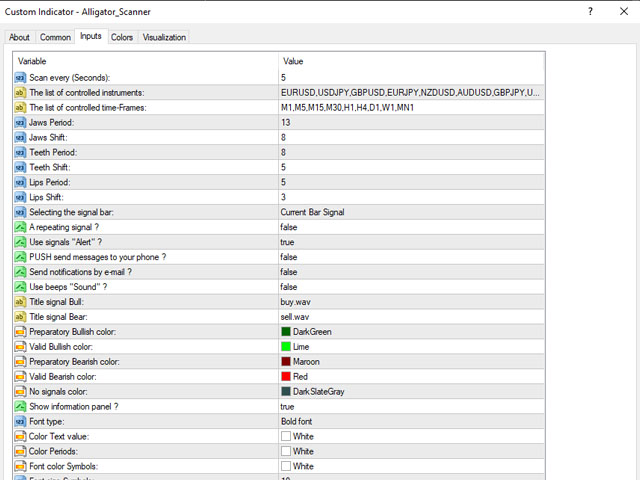
Scan all your favorite pairs with Alligator, and get notified on your preferred time frames.
Setting is Customizable
Click to change time frame or open new pairs
Notification: Phone/Popup/Email
추천 제품
GDS Renko Entry Helper - Free Renko Price Interaction Indicator for MetaTrader 5 GDS Renko Entry Helper is a free Renko price interaction indicator for MetaTrader 5. It helps traders highlight important areas where price reacts, slows down, returns to a zone or changes behavior around support and resistance. The tool is designed for manual Renko analysis. It does not generate buy or sell signals and does not tell the trader when to enter the market. Its purpose is to help focus attention on area
Market Trend Indicator Analog
Jose Maria Molina Sanchez
Market Trend Indicator Analog 저작권 2025, Jose María Molina Sánchez molinatrader67@gmail.com | 버전 1.00 소개 Market Trend Indicator Analog 는 시장의 트렌드 강도와 방향을 실시간으로 측정하도록 설계된 고급 지표입니다. 전통적인 오실레이터와 달리 이 지표는 시장 상황에 동적으로 반응하는 적응형 필터링 시스템을 사용하여 -100에서 +100 사이의 정확한 아날로그 표현을 제공합니다. 이 설계는 트레이더가 트렌드의 시작과 끝뿐만 아니라 그 강도까지 식별할 수 있도록 하여 더 정보 기반의 결정을 내리고 과도하거나 지연된 진입을 피할 수 있도록 도와줍니다. 지표 작동 방식 이 지표는 가격 변동성에 민감한 연속 신호를 생성하기 위해 여러 분석 기법을 결합한 독자적인 알고리즘을 기반으로 합니다. 결과는 세 가지 방식으로 표시됩니다: 별도 창에서: -100(최대 약세 강도)
MultiSignal Pro
Maksym Smyrnov
Market Structure, Liquidity & Confirmed Setup Engine for MetaTrader 5 Not another arrow indicator. MultiSignal analyses market structure, liquidity, displacement and confirmation before presenting a trading setup. The indicator is designed for traders who want structured market information instead of a chart filled with isolated BUY and SELL arrows . FROM MARKET STRUCTURE TO CONFIRMED SETUP MultiSignal analyses multiple conditions and presents the resulting setup directly on the chart. Liquidit
K Channel
Pavel Gotkevitch
K_Channel is a technical indicator defining the current Forex market status - trend or flat. The indicator works on any timeframe. H1 and higher timeframes are recommended though to minimize false signals. The indicator is displayed as lines above and below EMA. Average True Range (ATR) is used as bands' width. Therefore, the channel is based on volatility. This version allows you to change all the parameters of the main Moving Average. Unlike Bollinger Bands that applies the standard deviation
Structure King AI Signal
Shingala Gautamkumar
Structure King AI Signal Structure King AI Signal is a professional MetaTrader 5 trading indicator designed to help traders analyze market structure, trend direction, multi-timeframe confirmation and trade management from one clean dashboard. Key Features • Market Structure & Trend Analysis • BUY / SELL Signals • Multi-Timeframe (HTF) Confirmation • Entry Price Levels • Dynamic Stop Loss (SL) • TP1 / TP2 / TP3 Levels • ATR Volatility Analysis • ADX Trend Strength Filter • Adaptive Market Filter
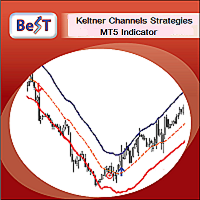
BeST_Keltner Channels Strategies MT5   is an  MT5  Indicator based on the original Keltner Channels Indicator and it can display in the Chart all the known Variations of Keltner Channels and also the corresponding 10 totally Strategies. Every such generally consists of a Central Moving Average Line and two Boundary Bands at a distance above and below it and can be traded mainly in a Trending Mode but also in a Ranging ReEntry Mode.  BeST_Keltner Channels Strategies Indicator Draws definite Buy
TRD Trend Range Detector MT5 — Market Regime Identification Indicator TRD Trend Range Detector MT5 is a technical analysis tool designed to identify market regimes. The indicator distinguishes between trending and consolidating (ranging) markets in real-time using a multi-factor algorithm. Market Regime Identification Many trading strategies are dependent on specific market conditions. TRD Trend Range Detector MT5 serves as a filter to identify when a trend is established or when the market is e
Swing Tracer
Ely Alsedy
5 (2)
it depends on ATR period to get swing points to help make better trading decisions  blue dot and red dot is the default color scheme of course you can change it later if you'd like  you can change the following : ATR PERIOD  sending notifications number of times to send notifications  sending notifications to your smart phone that's it very simple to use just drag and drop and follow the trend 
Titan Action HUD Titan Action HUD, MetaTrader 5 terminali içinde piyasa izlemeyi optimize etmek için tasarlanmış kapsamlı çok zaman dilimli analitik bir gösterge panelidir. Birden fazla dönemden alınan gerçek zamanlı teknik verileri tek bir ekrana toplayarak, çeşitli grafikler arasında sürekli geçiş yapma ihtiyacını ortadan kaldırır. Panel, piyasa ortamlarını sürekli tarar, yapısal trendleri, hacim metriklerini ve aktif işlem oturumlarını birleşik bir görsel matriks içinde gösterir. 6.10 sürümün
Pattern Trader No Repaint Indicator MT5 Version Indicator searches for 123 Pattern, 1234 Pattern, Double Top, Double Bottom Patterns , Head and Shoulders, Inverse Head and Shoulders, ZigZag 1.618 and Father Bat Pattern. Pattern Trader indicator uses Zig Zag Indicator and Improved Fractals to determine the patterns. Targets and Stop Loss Levels are defined by Fibonacci calculations.  Those levels must be taken as a recommendation. The trader may use different tools like Moving Avarages,
Veles ZigZag
Gennady Mazur
Представлен принципиально новый индикатор ZigZag, который отличается от стандартного абсолютной легкостью, быстродействием расчетов и очень высокой точностью. В основе индикатора заложен принцип цикличности рынка с совокупностью анализа количества текущих баров и их основных ценовых уровней. Чем меньше баров для определения расчетов, тем более агрессивная постройка линий индикатора. Как и в  стандартном индикаторе перерисовывается только последняя линия, при изменении достигнутого экстремума. П
RBreaker
Zhong Long Wu
RBreaker Gold Indicators는 금 선물을 위한 단기 데이 트레이딩 전략으로, 추세 추종과 데이 내 반전의 두 가지 거래 방식을 결합합니다. 추세 장에서 수익을 포착할 수 있을 뿐만 아니라, 시장이 반전될 때 적시에 이익을 확정하고 추세에 맞춰 반대 포지션을 잡을 수 있습니다. 이 전략은 미국 잡지 Futures Truth에서 15년 연속으로 가장 수익성 높은 트레이딩 전략 상위 10위 안에 선정되었습니다. 긴 라이프사이클을 자랑하며, 현재까지 국내외에서 널리 사용되고 연구되고 있습니다. 본 지표는 2026년 금 선물의 움직임을 반영하여 14일 ATR 지표를 기반으로 돌파 계수 A, 관찰 계수 B, 반전 계수 R을 보다 합리적인 값으로 정의했습니다. 매우 훌륭한 지표이며, 안정적인 연간 수익성을 달성했습니다. 강력히 추천합니다~ 위 지표는 변동성이 높은 상품에 적합하며, 매개변수는 금 선물, 주가 지수 선물 등에 적합합니다. 다른 상품이 필요한 경우 돌파 계수 A
Heiken_Ashi_Bars - MT5용 고급 추세 시각화 도구 개요 Heiken_Ashi_Bars 는 시장의 노이즈를 필터링하고 진정한 기본 추세를 강조하도록 설계된 강력하고 시각적으로 직관적인 사용자 지정 지표입니다. 기존의 캔들스틱 차트는 불규칙하여 거짓 신호와 섣불린 청산을 유발할 수 있습니다. 이 지표는 가격 데이터를 평균화하여 가격 움직임을 부드럽게 만들어 추세 지속, 반전 및 수익성 있는 진입 구간을 훨씬 쉽게 파악할 수 있도록 해줍니다. 주요 기능 및 장점 강력한 노이즈 감소: 사소한 가격 급등 및 횡보 노이즈를 필터링합니다. 명확한 시각적 신호: 색상으로 구분된 막대를 통해 강세 및 약세 모멘텀을 한눈에 파악할 수 있습니다. 리페인트 없음 (No Repaint): 막대가 마감되면 신호가 고정됩니다. 과거 막대를 다시 계산하지 않습니다. 고도로 최적화됨: 터미널 지연이 없도록 깔끔하게 코딩되었습니다. 다양한 활용: 모든 금융 상품(외환, 지수, 금속, 암호화폐)에서
FREE
RSI 볼린저 밴드 화살표 전략 (RSI Bollinger Bands Arrow Strategy) RSI 볼린저 밴드 화살표 전략은 RSI와 볼린저 밴드의 조합을 사용하여 높은 확률의 반전 지점을 식별하도록 설계된 깔끔하고 효과적인 기술 지표입니다. 이 전략은 RSI 지표를 볼린저 밴드와 함께 사용하여 다음을 수행합니다. 가격이 볼린저 밴드 상단 위에 있을 때 매도합니다. 가격이 볼린저 밴드 하단 아래에 있을 때 매수합니다. 두 지표가 동일한 시장 상황을 동시에 확인할 때만 신호가 생성되어 정확도를 높이고 잘못된 진입을 줄입니다. 작동 방식 매수 신호: 가격이 볼린저 밴드 하단 아래에서 위로 교차합니다. RSI가 정의된 과매도 수준을 위로 교차합니다. 차트에 녹색 매수 화살표가 나타납니다. 매도 신호: 가격이 볼린저 밴드 상단 위에서 아래로 교차합니다. RSI가 정의된 과매수 수준을 아래로 교차합니다. 차트에 빨간색 매도 화살표가 나타납니다. 이 간단한 전략은 RSI와
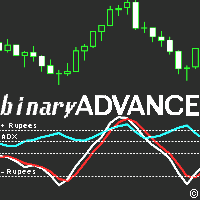
Binary Wave Advance
Nicholas C Weber
Update 2.2: Added MFI with predictive mod. Updated all indicators to reflect similar values, to combine multiple ones to rest well on overbought/oversold lines. Update 2.3: Minor bug fixes. Update 2.4: Removed buggy indicators DeMarker, and MACD, as it was too complicated and not as accurate as the rest due to it's nature. Added Awesome Oscillator. removed spreads, as it bogged the indicator down. Added other features, like indicator value compensators to match each other's levels when combined.
Meta Trend PRO MT5
Roman Podpora
5 (1)
메타 트렌드 프로       — 는 추세 추종 도구로, 거래에서 추측을 배제하고 시장이 이미 결정을 내린 지점을 보여줍니다. 이 지표는 추세, 추세선 및 구조가 변화하는 주요 지점을 식별하고 주요 참여자들이 포지션을 취할 수 있도록 가격이 되돌아오는 영역을 강조합니다. 단순히 가격 움직임만 보는 것이 아니라, 그 이면에 숨겨진 논리까지 이해할 수 있습니다. 모든 신호는 캔들 마감 후 기록되며, 다시 그려지지 않고 차트에 저장되므로 상황을 확실하게 분석하고 결정을 내릴 수 있습니다. 거래 목표(이익 실현) 또한 표시됩니다. 이 지표의 효과에 대해 완벽한 확신을 가지실 수 있도록 자동 통계 자료를 제공해 드립니다. 방향 전환 후에는 손절매 수준과 해당 수준이 지능적으로 점진적으로 이동하는 모습(Move SL)을 표시해주는데, 이는 매우 중요합니다.       감소시킨다       위험       위치별로. 손절매/이익실현/RR 오른쪽에 내장된 패널은 현재 글로벌 추세 방향의 시장 진입
Fibonacci Manager by Investio
Investio sp. z o.o.
4 (1)
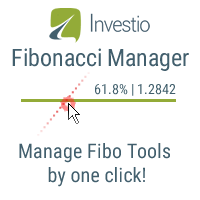
What was IFM created for Our goal in creating IFM was to provide the tool to manage your Fibonacci Retrecements and other Fibo tools in MetaTrader 5. This indicator allows you to edit all of the settings without getting into it by right click on the tool. That is faster and easiest way to manage objects on your chart. Inputs Font size - change font size of texts on the IFM panel. This is necessary, because some of users change font size in Windows settings Description of the Fibo levels (variab
Candlestick Pattern Scanner Pro — Indicator Description A comprehensive, customizable candlestick pattern recognition tool for MetaTrader 5, featuring ATR-based signal positioning, dynamic TP/SL levels, and multi-timeframe alert capabilities. Key Features ATR-Based Signal Management ATR Period & Multiplier : Dynamically calculates arrow signal distance based on market volatility. Dynamic TP/SL Levels : Set Take-Profit (TP1/TP2) and Stop-Loss levels using customizable ATR multipliers for
Double HMA MTF for MT5
Pavel Zamoshnikov
4 (4)
This is an advanced multi-timeframe version of the popular Hull Moving Average (HMA) Features Two lines of the Hull indicator of different timeframes on the same chart. The HMA line of the higher timeframe defines the trend, and the HMA line of the current timeframe defines the short-term price movements. A graphical panel with HMA indicator data from all timeframes at the same time . If the HMA switched its direction on any timeframe, the panel displays a question or exclamation mark with a tex
Liquidity Touch Zones PRO X
Viacheslav Bashkirtsev
Liquidity Touch Zones PRO X - is   a support and resistance indicator that identifies   price areas of confirmed strength   formed by repeated price interactions and displayed taking into account the instrument's characteristic volatility. The calculation is based on fractal points, which serve as initial benchmarks. These points form price zones reflecting repeated price interactions and are represented as areas of varying heights depending on the level's significance. It is designed for trader
Strutural Trend Lines MT5
Vincent Jose Proenca
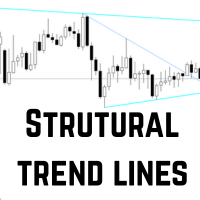
STRUCTURAL TREND LINES - MT5 Indicator Simple indicator that automatically draws trend lines based on market structure. Features: - 3 degrees of structure detection (short, medium, long term) - Configurable swing strength for each degree - Single color per degree for clean visualization - Adjustable number of lines per degree - Customizable colors and line widths How it works: The indicator identifies swing highs and lows based on the strength parameter, then connects these points to create t
ZLMA Trend Candles indicator uses an enhanced Zero-Lag Moving Average to highlight key trend shifts, repainting candles in real time. It reacts faster than traditional moving averages, helping you spot potential market turns earlier. Gain clear entry and exit signals and filter out market noise with ease! This product is also available for MetaTrader 4 =>  https://www.mql5.com/en/market/product/129279 1. What Is ZLMA Trend Candles? ZLMA Trend Candles is a MetaTrader 4/5 indicator based on the Z
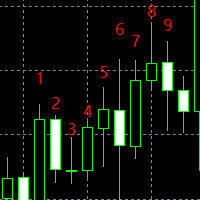
神奇九转, 顾名思义就是每当出现数字9时,行情就很大的几率会发生逆转,这时应该注意止盈。是一个很有效的指标。 在序列显示和形成过程中,一旦出现不符合触发条件的情况,则前面序列数字消失,本次九转序列结构不存在。如果连续九天都达到触发条件,九转序列结构形成,价格走势可能发生反转。 九转序列可分为上升九转结构和下降九转结构,也就是九转序列在买多和买空以及判断各种走势反转是都可以使用。 九转序列买入建仓,即下降九转序列结构形成时,价格走势将要发生转变,考虑建仓买入。 买入条件:连续出现九根K线,并且满足收盘价都低于前一根K线收盘价,当第8、9根K线满足上述条件时,九转序列形成,投资者准备买入建仓。 使用分时九转时需要注意两点: 1、极端行情时(连续上涨或下跌),九转序列失效; 2、当九转序列完全形成时,再进场操作(尤其不用刚出现数字8或9就入场,一定要完全形成之后才可以。)
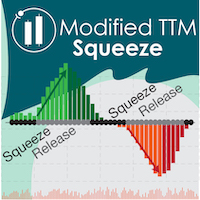
"The Squeeze indicator attempts to identify periods of consolidation in a market. In general the market is either in a period of quiet consolidation or vertical price discovery. By identifying these calm periods, we have a better opportunity of getting into trades with the potential for larger moves. Once a market enters into a "squeeze," we watch the overall market momentum to help forecast the market direction and await a release of market energy." The Modified TTM Squeeze Indicator is a modi
InfinX Slope MT5
Stanislav Shtiliyanov
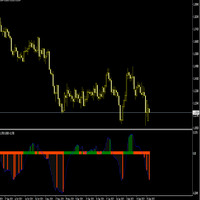
The Slope indicator   measures the slope of a linear regression , which is the line of best fit for a data series. A 20-period Slope, therefore, measures the slope of a 20-day linear regression. ... In general, a positive slope indicates an uptrend, while a negative slope indicates a downtrend. How do you use slope Indicator? By applying the slope indicator  to both the price chart and the price relative , chartists can quantify the price trend and relative performance with one indicator. A pos
Trend Master V2
Oratile Pitsoane
What Is Trend Master Pro? Trend Master Pro   is a professional-grade trend trading indicator built for MetaTrader 5. It was designed with one goal in mind — to keep you on the right side of the market at all times by combining three powerful technical tools into a single, clean, easy-to-read display directly on your price chart. Instead of cluttering your screen with multiple separate indicators, Trend Master Pro fuses an   EMA Ribbon trend filter , a   ZigZag swing point engine , and a   breako
Rsi Trendline Break
Ich Khiem Nguyen
RSI Trendline Break MT5 Systematic Momentum Trendline Breakout and Trend Continuation Engine The RSI Trendline Break indicator for MetaTrader 5 provides an objective analytical framework designed to identify high-probability trend-continuation setups by tracking leading momentum breaks. Intraday traders and scalpers frequently encounter execution timing errors on raw price charts: entering immediately before a corrective retracement, suffering premature stop-outs from erratic boundary wicks duri
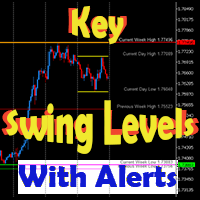
This dynamic indicator will draw the Key Swing High and Low Levels for any symbol on any timeframe! User may Hide or Show any Level or Label and also Receive Alerts when price returns to that key level via Pop-Up, Push, Email or Sound. Levels include Current Day High/Low, Previous Day High/Low, Current Week High/Low, Previous Week High/Low and Monthly High/Low. The Levels are labeled with the Price Point Data Listed next to it for quick easy reference.  You can change the Style, Size and Co
Over Trend MT5
Mansour Babasafary
Trend based indicator Identify trends with this indicator A simple-to-use trend indicator No complicated settings Attributes: Can be used in all symbols Can be used in all time frames Relatively high signals No complicated settings Specific to the trend Lifetime support Settings: Alarm Show Alert: By activating these settings, after receiving the signal, you will receive an alarm in Metatrader Alarm Show Notification: By activating these settings, after receiving the signal, you will receive a
The indicator is the advanced form of the MetaTrader 4 standard Fibonacci tool. It is unique and very reasonable for serious Fibonacci traders. Key Features Drawing of Fibonacci retracement and expansion levels in a few seconds by using hotkeys. Auto adjusting of retracement levels once the market makes new highs/lows. Ability to edit/remove any retracement & expansion levels on chart. Auto snap to exact high and low of bars while plotting on chart. Getting very clear charts even though many ret
이 제품의 구매자들이 또한 구매함
Trend Sniper X
Sarvarbek Abduvoxobov
4.9 (41)
Trend Sniper X 는 트레이더가 추세 방향과 잠재적 반전 지점을 명확하고 정확하게 포착할 수 있도록 도와주는 MetaTrader 5용 멀티 타임프레임 추세 추종 지표입니다. MT4용: https://www.mql5.com/en/market/product/193245 가격 정보: 현재 가격은 프로모션 할인가이며, 향후 업데이트 및 새로운 기능이 출시됨에 따라 변동될 수 있습니다. 보너스 혜택: 본 지표 전용 무료 자동매매 Assistant EA를 받으시려면 구매 후 작성자에게 메시지를 보내주시기 바랍니다. Code2Profit 채널 멀티 타임프레임 분석으로 시장을 마스터하세요! Trend Sniper X로 승률을 극대화하는 방법: 핵심 규칙 및 세션 팁 기술 사양 플랫폼 MetaTrader 5 지표 유형 멀티 타임프레임 추세 지표 운용 타임프레임 모든 차트 타임프레임 지원, 독립적으로 선택 가능한 상위 타임프레임(M1–MN1) 주요 상품 외환, 금(XAUUSD) 및 기타 C
Smart Trend Trading System — MetaTrader 5 구매 후 MQL5에서 저에게 메시지를 보내시면 Smart Universal Expert Advisor를 무료로 받으실 수 있으며, 온라인 강좌, PDF 매뉴얼 및 비공개 그룹 이용 권한도 함께 제공됩니다. STTS는 추세 방향, 진입·청산 신호, 반전 구간, 주요 가격 수준을 차트에 모아 보여줍니다. 시스템을 참고해 수동으로 거래하거나, 별도의 호환 EA를 연결하여 선택한 설정에 따라 자동으로 거래를 실행할 수 있습니다. 하나의 시스템, 네 가지 트레이딩 접근법 STTS의 트레이딩 접근법은 크게 네 가지로 나뉩니다. • 스캘핑 — 단기 신호와 시장 움직임을 살펴봅니다. • 추세 매매 — 방향을 평가하고 추세 안에서 기회를 찾습니다. • 반전 매매 — 잠재적인 전환 구간과 방향 변화를 파악합니다. • 거래량 매매 — 거래량 기반 정보로 시장 활동을 평가합니다. 진입·청산 화살표, 추세 정보, 지지·저항 수
Zoryk Gold
Reda El Koutbane
5 (16)
ZORYK — MetaTrader 5용 XAUUSD 전문 신호 및 트레이드 플래닝 시스템 이런 경험이 있을 것입니다. 골드를 분석하고 진입을 기다린 뒤 마침내 포지션을 열었지만 가격이 곧바로 반대 방향으로 움직입니다. 너무 일찍 청산하거나 Stop Loss를 옮기거나 몇 초 동안 망설입니다. 그 후 시장은 내가 없이도 처음 예상했던 목표까지 정확히 움직입니다. 문제는 항상 방향이 아니었습니다. 진짜 문제는 불확실성이었습니다. 정확한 진입 위치를 몰랐습니다. 어느 지점에서 원래의 트레이드 아이디어가 무효가 되는지 몰랐습니다. 가까운 수익을 확보해야 할지 더 큰 움직임을 기다려야 할지 판단하기 어려웠습니다. 현재 setup이 정말 강한지 아니면 단지 새로운 거래를 억지로 찾고 있는지도 확신하기 어려웠습니다. 골드는 매우 빠르게 움직입니다. 명확한 계획이 없다면 좋은 분석도 몇 초 만에 나쁜 결정으로 바뀔 수 있습니다. ZORYK는 이 문제를 해결하기 위해 개발되었습니다.
SuperScalp Pro
Van Minh Nguyen
4.56 (36)
SuperScalp Pro - Professional Multi-Layer Confluence Scalping System SuperScalp Pro는 클래식 Supertrend에 여러 지능형 확인 필터를 추가한 고급 스캘핑 지표입니다. 더 높은 확률의 Buy/Sell 거래 기회를 식별하는 데 도움을 주며, 잘못된 신호를 크게 줄이는 데 도움을 줍니다. 명확한 Buy 및 Sell 화살표가 차트에 직접 표시되며, ATR 기반 Stop Loss 및 Take Profit 수준이 실시간으로 자동 계산됩니다. 구매 후 설정 방법 및 권장 구성에 대한 안내가 필요하시면 저에게 문의해 주세요. SuperScalp Pro Auto Trader를 사용하여 신호를 쉽게 자동화할 수 있습니다: [Auto Trader] 권장 설정 파일 다운로드: [Set File] 전체 문서는 제품 블로그에서 확인할 수 있습니다: [User Guide] 업데이트를 확인하려면 공식 채널에 참여하세요: [Official C
새로운 왕의 등장 - 인디케이터 + 주문 관리 표시(TP1 + TP2 + TP3) + 선택형 텔레그램 시그널 전송 기능 포함 (무료) (완전한 트레이딩 및 시그널 시스템) 골드를 위한 최고의 EA: Gold Slayer 이 인디케이터는 고급 전략, 사용자 지정 가능한 주문 관리 시스템, 그리고 엔벨로프 확장을 결합한 평균 회귀(mean reversion) 시스템을 포함하고 있습니다. 또한 RSI와 같은 여러 지능형 확인 필터를 통해 높은 확률의 반전 진입 구간을 포착하여 BUY 및 SELL 시그널을 제공합니다. 단순히 거래 방법만 배우는 것이 아니라, 여러 포지션을 효과적으로 관리하고 이전에 수익 중인 오픈 포지션으로 손실 거래를 커버하는 방법까지 익힐 수 있습니다. M5 전용으로 설계 및 최적화되었으며, 유동성이 풍부해 시그널이 더 깔끔하고 신뢰도 높은 BTCUSD와 XAUUSD에서 뛰어난 성능을 발휘합니다. 이 인디케이터는 ATR 기반으로 자동 계산된 진입가, 손절가, 익절가와
SMC Intraday Formula
VividMind Digital Solutions
5 (26)
먼저 솔직하게 말하겠습니다. 어떤 인디케이터도 단독으로 당신을 수익성 있게 만들어주지 않습니다. 누군가 그렇게 말한다면, 그는 당신에게 꿈을 파는 것입니다. 완벽한 매수/매도 화살표를 보여주는 모든 인디케이터는 완벽하게 보이도록 만들 수 있습니다 — 단지 올바른 과거 구간을 확대하고 승리한 거래만 캡처하면 됩니다. 우리는 그렇게 하지 않습니다.  SMC Intraday Formula는 도구입니다. 시장 구조를 읽고, 가장 높은 확률의 가격 구간을 표시하며, 현재 스마트 머니의 흐름이 어떻게 보이는지 아주 단순한 언어로 보여줍니다. 최종 결정은 여전히 당신이 합니다. 실행도 당신이 합니다. 하지만 이제는 희망이 아니라 정확성으로 거래하게 됩니다. 우리는 이 인디케이터를 지난 약 3년 동안 골드(XAUUSD) 및 주요 외환 통화쌍의 데이 트레이딩 스캘핑에 사용해 왔습니다. M1, M5, M15, M30에서 우리의 핵심 도구입니다. 이 도구는 미래를 예측하려 하지 않습니다 — 지금 형성
GoldenX Entry MT5
VividMind Digital Solutions
5 (16)
GoldenX Entry는 MT5용 인디케이터로, 적응형 Smart Entry Trend 알고리즘, 신호 스코어링 시스템, 시장 레짐 감지 기능, 그리고 변동성 필터를 포함합니다. 각 신호에는 계산된 진입 레벨, 3개의 익절(TP1, TP2, TP3) 레벨, 그리고 손절(Stop-Loss) 레벨이 포함됩니다. 이 인디케이터는 다양한 시장 환경에 적응하도록 설계된 다중 분석 레이어 구조 위에 구축되어 있으며, 내장 최적화기와 통계 추적 시스템을 결합합니다. 또한 Risk-to-Reward(RR) 지표와 과거 거래 행동 기반의 정량 분석을 제공합니다. 시작은 간단합니다 — 선택한 타임프레임에서 최적화기를 실행한 뒤 차트에서 바로 인디케이터를 사용하면 됩니다. 핵심 기능 GoldenX Entry는 하나의 차트에서 신호 엔진, 트레이드 관리 기능, 그리고 과거 통계 추적을 통합합니다: - 내장 최적화기: 최적화기는 차트에서 원클릭으로 실행됩니다. 200개의 파라미터 조합을 두 단계 탐색
Entry Points Pro for MT5
Yury Orlov
4.52 (151)
전설이 돌아왔습니다: Entry Points Pro 10. MQL5 마켓 Top-3 자리를 3년간 지켜온 전설적인 지표의 재출시입니다. 수백 개의 호평 리뷰(두 버전 합산 589개), 매일 이 지표로 거래하는 수천 명의 트레이더, 31,000회 이상의 데모 다운로드   MT4+MT5 . 지난 5년간 여러분이 남긴 리뷰를 하나도 빠짐없이 읽었고, 약속 대신 그 답을 버전 10에 담았습니다. 1999년부터 시장에서 활동하며 정직함과 자신의 평판, 그리고 고객을 소중히 여기는 개발자가 만들었습니다. Entry Points Pro의 진입 시그널은 절대 리페인팅되지 않습니다. 그리고 이번에는 개발자의 말뿐이 아니라 검증 가능한 사실입니다: 확정 시그널은 캔들 종가에서만 표시되며, 자동화 테스트에서 리페인팅 0건 이 확인되었습니다(EURUSD, XAUUSD, BTCUSD에서 2,486,568회의 불변조건 검사 — 위반 0건). 검증 방법은 공개되어 있으니 전략 테스터에서 직접 재현해 보실 수
Gann Made Easy MT5
Oleg Rodin
5 (11)
Gann Made Easy 는 mr.의 이론을 사용하여 최고의 거래 원칙을 기반으로 하는 전문적이고 사용하기 쉬운 Forex 거래 시스템입니다. W.D. 간. 이 표시기는 Stop Loss 및 Take Profit Levels를 포함하여 정확한 BUY 및 SELL 신호를 제공합니다. PUSH 알림을 사용하여 이동 중에도 거래할 수 있습니다. 구매 후 거래 방법 안내 및 유용한 추가 지표를 무료로 받으시려면 저에게 연락주세요! 아마도 Gann 거래 방법에 대해 이미 여러 번 들었을 것입니다. 일반적으로 Gann의 이론은 초보자 거래자뿐만 아니라 이미 거래 경험이 있는 사람들에게도 매우 복잡한 것입니다. Gann의 거래 방식은 이론적으로 적용하기 쉽지 않기 때문입니다. 나는 그 지식을 연마하고 Forex 지표에 최고의 원칙을 적용하기 위해 몇 년을 보냈습니다. 표시기는 적용하기가 매우 쉽습니다. 차트에 첨부하고 간단한 거래 권장 사항을 따르기만 하면 됩니다. 지표는 지속적으로 시장 분석
ARIPoint
Temirlan Kdyrkhan
1 (4)
ARIPoint is a powerful trading companion designed to generate high-probability entry signals with dynamic TP/SL/DP levels based on volatility. Built-in performance tracking shows win/loss stats, PP1/PP2 hits, and success rates all updated live. Key Features: Buy/Sell signals with adaptive volatility bands Real-time TP/SL/DP levels based on ATR Built-in MA Filter with optional ATR/StdDev volatility Performance stats panel (Success, Profit/Loss, PP1/PP2) Alerts via popup, sound, push, or email Cu
당신의 트레이딩 우위를 한눈에 확인하세요! M5 Sniper 는 MeanFX의 새로운 지표입니다. 정확한 트레이딩 신호 와 적응형 TP/SL 레벨 을 결합하여, 결과적으로 가능한 최고의 통계적 트레이딩을 만들어냅니다! 5회 구매마다 가격이 인상되며, 다음 가격은 69$입니다. 구매 후 저에게 메시지를 보내주시면 팁/가이드와 보너스 EA를 제공해 드립니다. 무엇이 이 지표를 특별하게 만들까요? Gold XAUUSD에서 검증된 통계적 성과 ( 거의 모든 자산에서 작동 하며, 일관된 결과 없이 모든 것을 다루려고 하기보다는 하나의 타임프레임을 완전히 익히는 데 집중합니다) 각 심볼당 하루 1~8회의 트레이드 와 높은 승률을 제공하며, 모든 통계적 우위를 우리의 편으로 가져갑니다. 차트에는 확인된 BUY 및 SELL 신호만 표시됩니다. 각 트레이드에 대해 지표가 생성하는 적응형 TP 및 SL 레벨 평균 승률 75%+ 평균 Signal Ratio 최소 1.1+ 알람 및 알림이 휴대폰 으로도
Neuro Poseidon MT5
Daria Rezueva
4.75 (52)
Neuro Poseidon is a new indicator by Daria Rezueva. It combines precise trading signals with adaptive TP/SL levels - creating best possible trades as a result! Message me and get  Neuro Poseidon Assistant  as a gift to automize your trading process! What makes it stand out? 1. Proven profitability on all assets and timeframes 2. Only confirmed BUY and SELL signals present on the chart 3. Adaptive TP & SL levels generated by the software for each trade 4. Easy to understand - suitable for al
Auto Optimized SpeedAngle 은 지속적인 워크포워드 최적화(Walk-Forward Optimization, WFO)를 통해 곡선 적합(curve-fitting)을 제거한 기관 수준의 모멘텀 벡터화 시스템입니다. 시장 체제가 바뀔 때 성능이 떨어지는 정적 입력에 의존하는 대신, 이 지표는 표본 외(Out-of-Sample, OOS) 검증을 사용하여 매개변수를 동적으로 재보정하며, 표시되는 신호가 과거의 우연이 아닌 진정한 통계적 우위를 나타내도록 보장합니다. 핵심 기관용 프레임워크 워크포워드 최적화 엔진: 핵심 알고리즘은 수천 가지의 룩백(lookback) 및 임계값 조합을 지속적으로 스캔하며, 데이터를 인샘플(in-sample)과 표본 외(out-of-sample) 세트로 엄격하게 분리합니다. 미지의 데이터 환경에서 수학적 우수성이 증명된 경우에만 새로운 매개변수 구성을 채택합니다. 정량적 목적 함수: 순수한 총이익을 쫓는 대신, 최적화 엔진은 기관 수준의 안정성
안녕하세요, 트레이더 여러분! 많은 개인 투자자들이 느린 웹 스크립트에 의존하고 있습니다. 수익성 있는 거래를 위해서는 체계적인 프레임워크가 필수적입니다. Astro AI 지표는 단순한 차트 오버레이가 아닙니다. 터미널에서 직접 실행되는 두 개의 에이전트로 구성된 정교한 신경망입니다. 시스템 기술 상세 설명: 1. 에이전트 1: 분석가 (그래픽 신경망 – GNN) 시장은 개별 가격 막대로 이루어진 것이 아니라 상호 연결된 데이터 네트워크입니다. 기능: 에이전트 1은 그래픽 신경망을 사용하여 이러한 복잡하고 비선형적인 관계를 파악합니다. 장점: 기존 지표는 과거 이동 평균만을 고려하는 반면, 저희 GNN은 시장의 심층적인 구조적 관계를 실시간으로 처리하여 개별 트레이더의 거래량이 시장에 큰 영향을 미치기 전에 숨겨진 상관관계를 찾아냅니다. 2. 에이전트 2: 실행기 (근접 전략 최적화 – PPO) 패턴 인식은 절반의 성공일 뿐입니다. 현재 시장 변동에 기반하여 올바른
Adaptive Price Action Engine 지표를 구매하면 EA(자동매매 프로그램)가 무료 멀티 타임프레임 기반 자기 최적화 추세 & 캔들 패턴 분석 시스템 시장은 끊임없이 변화하며, 모든 Price Action 패턴이 모든 시장 환경에서 동일한 가치를 가지는 것은 아닙니다. Adaptive Price Action Engine 은 변화하는 시장 환경에 적응할 수 있도록 설계되었으며, 추세 구조, 멀티 타임프레임 분석, 캔들 패턴 및 통계적 최적화 를 하나의 분석 프레임워크로 결합합니다. 두 가지 적응형 모드 Dual Alpha Trend Mode 낮은 타임프레임과 높은 타임프레임에서 적합한 Alpha Trend 파라미터를 자동으로 탐색하여, 최근 시장 움직임에 맞춰 추세 분석을 조정합니다. Candlestick + Alpha Mode Alpha Trend를 통한 시장 국면 분석과 22개의 상승 및 하락 캔들 패턴 을 결합합니다. 모든 패턴을 동일하게 취급하는 대신, 다양
Welcome to ENTRY IN THE ZONE AND SMC MULTI TIMEFRAME  SPECIAL BENEFIT / FOR OUR MQL5 CUSTOMERS FREE ACCESS TO THE NEW TOOL  — COMING SOON — Learn more on our official website  : https://www.fableedge.net YouTube Channel : 24/7 LIVE SIGNALS  :   https://www.youtube.com/@FableEdgeView Entry In The Zone and SMC Multi Timeframe is a real-time market analysis tool based on Smart Money Concepts (SMC) , designed to analyze market structure, price direction, and key trading zones. It supports both Sing
M1 Sniper MT5
Oleg Rodin
5 (7)
M1 SNIPER 는 사용하기 쉬운 거래 지표 시스템입니다. M1 시간대에 맞춰 설계된 화살표 지표입니다. 이 지표는 M1 시간대 스캘핑을 위한 단독 시스템으로 사용할 수 있으며, 기존 거래 시스템의 일부로도 사용할 수 있습니다. 이 거래 시스템은 M1 시간대 거래용으로 특별히 설계되었지만, 다른 시간대에도 사용할 수 있습니다. 원래는 XAUUSD와 BTCUSD 거래를 위해 이 방법을 설계했지만, 다른 시장 거래에도 유용하다는 것을 알게 되었습니다. 이 지표의 신호는 추세 방향과 반대로 거래될 수 있습니다. 저는 지표의 신호를 활용하여 양방향으로 거래할 수 있도록 돕는 특별한 거래 기법을 알려드립니다. 이 방법은 특별한 동적 지지선과 저항선 가격 영역을 활용하는 것을 기반으로 합니다. 구매하시면 M1 SNIPER 화살표 지표를 바로 다운로드하실 수 있습니다. 또한, 아래 스크린샷에 표시된 Apollo Dynamic SR 지표는 M1 SNIPER 도구를 사용하는 모든 사용자에게 무료로
Divergence Bomber
Ihor Otkydach
4.89 (94)
이 지표를 구매하신 분께는 다음과 같은 혜택이 무료로 제공됩니다: 각 거래를 자동으로 관리하고, 손절/익절 수준을 설정하며, 전략 규칙에 따라 거래를 종료하는 전용 도우미 툴 "Bomber Utility" 다양한 자산에 맞게 지표를 설정할 수 있는 셋업 파일(Set Files) "최소 위험", "균형 잡힌 위험", "관망 전략" 모드로 설정 가능한 Bomber Utility의 셋업 파일 이 전략을 빠르게 설치, 설정, 시작할 수 있도록 돕는 단계별 영상 매뉴얼 주의: 위의 모든 보너스를 받기 위해서는 MQL5 개인 메시지 시스템을 통해 판매자에게 연락해 주세요. 독창적인 커스텀 지표인 “Divergence Bomber(다이버전스 봄버)”를 소개합니다. 이 지표는 MACD 다이버전스(괴리) 전략을 기반으로 한 올인원(All-in-One) 거래 시스템입니다. 이 기술 지표의 주요 목적은 가격과 MACD 지표 간의 다이버전스를 감지하고, **향후 가격이 어느 방향으로 움직일지를 알려주
Unix Scalper
Issam Kassas
4 (4)
Unix Scalper — MetaTrader 5 구매 후 MQL5에서 저에게 메시지를 보내시면 Smart Universal Expert Advisor를 무료로 받으실 수 있으며, 온라인 강좌, PDF 매뉴얼 및 비공개 그룹 이용 권한도 함께 제공됩니다. 매매 기회를 찾고, 거래 계획을 확인하고, 실행 방법을 선택하세요. UNIX Scalper는 시장 분석, BUY/SELL/WAIT 판단, Entry, Stop Loss, TP1 및 TP2 가격 수준을 하나의 정돈된 패널에 제공합니다. 신호와 거래 계획을 한눈에 • 명확한 판단: BUY, SELL 또는 WAIT. • 구체적인 가격 수준: Entry, Stop Loss, TP1 및 TP2. • 다중 시간대 개요: 패널의 여러 시간대 신호를 비교하세요. • 판단을 돕는 분석: 추세, 모멘텀, 거래량, 변동성, 지지와 저항, 시장 품질. • 다양한 레이아웃: Minimized, Compact, Standard 또는 Full. 신호와
Scalper Vault 는 성공적인 스캘핑에 필요한 모든 것을 제공하는 전문 스캘핑 시스템입니다. 이 표시기는 외환 및 바이너리 옵션 거래자가 사용할 수 있는 완전한 거래 시스템입니다. 권장 시간 프레임은 M5입니다. 시스템은 추세 방향으로 정확한 화살표 신호를 제공합니다. 또한 상단 및 하단 신호와 Gann 시장 수준을 제공합니다.  이 시스템은 사용하기가 매우 쉽습니다. 원하는 시장 지역의 화살표만 따라가면 됩니다. 엑시트는 가격이 적정 수준에 도달하거나 시장의 고점 또는 저점 신호가 나타날 때 수행됩니다.  표시기는 PUSH 알림을 포함한 모든 유형의 경고를 제공합니다. 인디케이터 구매 후 연락주세요. 내 개인 거래 권장 사항과 훌륭한 보너스 지표를 무료로 공유합니다! 나는 당신에게 행복하고 유익한 거래를 기원합니다!
Tokyo mt5 Indicator
Vasiliy Strukov
5 (9)
Tokyo Indicator는 추세 방향, 잠재적 거래 신호 및 시장 상황을 명확하고 시각적으로 보여줍니다. 색상으로 구분된 계단식 추세선은 강세 구간(파란색)과 약세 구간(자홍색)을 명확히 구별해 줍니다. 추세가 전환될 때 나타나는 방향성 화살표는 잠재적인 매수 및 매도 기회를 강조하여 보여줍니다. 통합 대시보드는 현재 신호, 시장 성향(bias), 모멘텀, 변동성, 신호 품질 등의 정보를 한눈에 파악할 수 있도록 구성되어 있습니다. 이를 통해 트레이더는 별도의 패널을 오갈 필요 없이 가격 움직임(price action)과 지표의 데이터를 동시에 분석할 수 있습니다. 깔끔한 차트 화면과 간결한 시장 개요를 제공하는 Tokyo Indicator는 체계적인 추세 분석과 거래 결정을 지원합니다. 모든 시간대와 다양한 자산(특히 금)에서 활용할 수 있습니다. 추세 방향, 잠재적 거래 신호 및 시장 상황을 명확하고 시각적으로 보여줍니다. 색상으로 구분된 계단식 추세선은 강세 구간(파란색)
RelicusRoad Pro MT5
Relicus LLC
4.96 (25)
거래를 더 이상 감으로 하지 마세요. 언제 진입할지, 어디서 청산할지, 시장이 어느 쪽으로 기울어 있는지를 한 차트에서 확인하세요. RelicusRoad Pro는 20개 가까운 도구를 인디케이터 하나에 담았고, 내 매매 방식에 맞는 도구만 켜서 쓰면 됩니다. 명확한 진입. 명확한 청산. 차트마다 확실한 계획. 이런 경험, 익숙하지 않으신가요? 매수하면 1분 뒤 가격이 반대로 돌아섭니다. 너무 일찍 청산하고, 그다음 움직임이 나 없이 이어지는 것을 지켜봅니다. 지표를 5개 띄우면 답도 5가지가 나옵니다. 손절(스톱로스)은 그냥 감입니다. 우리가 이걸 만든 이유 우리는 18년 동안 외환 거래를 해 왔습니다. RelicusRoad는 처음에 우리끼리 쓰려고, 전문 트레이더 모임을 위해 비공개로 만들었습니다. 이유는 개인적이었습니다. 같은 선을 손으로 계속 그리는 일에 지쳤고, 스스로 정한 규칙을 어기고, 차트에서 정말 중요한 한 가지를 놓치곤 했습니다. 우리에게 통한 것은 일관성입니다. 매
FiboSniper Pro
Van Minh Nguyen
5 (3)
FiboSniper Pro – Multi-Filter Fibonacci System with Auto SL/TP and Control Panel FiboSniper Pro는 동적 Fibonacci Envelopes와 여러 확인 필터를 결합하여 선별된 Buy 및 Sell 신호를 생성하는 기술적 지표입니다. Fibonacci 레벨은 Moving Average와 ATR을 기반으로 계산된 후 ADX, EMA, RSI, ATR, Volume, Time 및 Candle 구조를 통해 필터링됩니다. 이 지표는 ATR 기반의 자동 Stop Loss 및 Take Profit 레벨을 차트에 직접 표시하며, 빠른 설정 조정을 위한 인터랙티브 Control Panel을 제공합니다. 구매 후 권장 설정 파일과 자세한 사용 방법을 받으려면 저에게 문의해 주세요. Auto Trader X를 사용하여 FiboSniper Pro 신호를 자동화할 수 있습니다: [Auto Trader X] User Guide 및 Se
Market Structure Order Block Dashboard MT5는 시장 구조와 주요 가격 반응 구역을 차트에서 직접 읽고자 하는 트레이더를 위해 설계된 MT5 지표입니다. BOS, ChoCH, 오더 블록, Fair Value Gap (FVG), 유동성, Kill Zones, Volume Profile 그리고 빠른 분석을 위한 콤팩트한 대시보드를 결합합니다. 이 지표는 시장 구조, ICT 및 Smart Money 개념을 의사결정 프레임워크로 사용하는 트레이더를 대상으로 합니다. 추세 지속, 가능한 반전, 가격 불균형, 유동성 타겟 및 관심 구역을 보다 체계적으로 식별하는 데 도움을 줄 수 있습니다. 구매자를 위한 포함 리소스 구매 후 MQL5 개인 메시지로 요청하시면 완전한 PDF 사용 설명서와 파라미터 설정 팁을 제공해 드립니다. MQL5 개인 메시지를 통한 직접 기술 지원. 1.20 버전은 두 가지 주요 추가 기능을 제공합니다: Pending BOS / Pending
소개       Quantum Breakout PRO   , 브레이크아웃 존 거래 방식을 변화시키는 획기적인 MQL5 지표! 13년 이상의 거래 경험을 가진 숙련된 트레이더 팀이 개발한       퀀텀 브레이크아웃 PRO       혁신적이고 역동적인 브레이크아웃 존 전략으로 거래 여정을 새로운 차원으로 끌어올리도록 설계되었습니다. Quantum Breakout Indicator는 5개의 이익 목표 영역이 있는 브레이크아웃 영역의 신호 화살표와 브레이크아웃 상자를 기반으로 한 손절 제안을 제공합니다. 초보자 거래자와 전문 거래자 모두에게 적합합니다. Quantum EA 채널:       여기를 클릭하세요 중요한! 구매 후 설치 매뉴얼을 받으려면 개인 메시지를 보내주십시오. 추천: 기간: M15 통화쌍: GBPJPY, EURJPY, USDJPY,NZDUSD, XAUUSD 계정 유형: 스프레드가 매우 낮은 ECN, Raw 또는 Razor 브로커 시간: GMT +3 중개인 :
Trend Catcher ind mt5
Ramil Minniakhmetov
5 (18)
트렌드 캐처 인디케이터 트렌드 캐처 인디케이터는 개발자가 자체 개발한 맞춤형 적응형 트렌드 분석 지표들을 조합하여 시장 가격 움직임을 분석합니다. 단기적인 노이즈를 제거하고 근본적인 모멘텀 강도, 변동성 확대, 가격 구조 움직임에 집중하여 진정한 시장 방향을 파악합니다. 또한 이동 평균, RSI, 변동성 필터와 같은 맞춤형 지표들을 활용하여 가격을 평활화하고 트렌드를 필터링합니다. 실제 운영 모니터링 및 기타 제품은 다음 링크에서 확인하실 수 있습니다:   https://www.mql5.com/en/users/mechanic/seller 텔레그램에서는 EA나 설정 파일을 판매하지 않습니다. 사기이니 주의하세요. 모든 설정 파일은 블로그에서 무료로 제공됩니다. 중요! 구매 후 즉시 연락 주시면 사용 방법 및 보너스를 드립니다!
Quant Direction MT5
Georgios Kalomoiropoulos
Quant Direction 은 3D 시장 분석 도구입니다. 다양한 매개변수에 걸쳐 정확한 백분율 편차를 계산하면서 완벽하게 객관적인 알고리즘 기반 시장 분석을 제공합니다. 첨단 AI 기반 모델링 도구와 엄격한 테스트를 거쳐 개발된 이 알고리즘은 타의 추종을 불허하는 정확도로 시장을 분석합니다. 플랫폼에서 모든 통화쌍 또는 금융 상품을 분석할 수 있습니다. 단기 거래, 데이 트레이딩, 스윙 트레이딩 등 어떤 유형의 거래를 하든 Quant Direction은 최적의 선택입니다. 운영자가 되는 것의 진정한 이점 퀀트 디렉션의 진정한 장점은 감정, 눈의 피로, 과도한 분석을 완전히 배제한다는 점입니다. 더 이상 수십 개의 차트를 일일이 살펴보며 방향을 찾거나 자신의 판단에 끊임없이 의문을 품을 필요가 없습니다. 이 시스템은 8개의 시간 간격(5개월에서 수개월까지)을 밀리초 단위로 처리합니다. 특정 시점의 주요 시장 참여자를 정확하게 식별하여 항상 성공 확률이 가장 높은 방향으로 거래할
Volatility Master for MetaTrader is a real-time dashboard tool that scans up to  50 symbols  to identify high-volatility , trending markets instantly. With bullish/bearish signals, customizable alerts, and a user-friendly interface, it helps you avoid range-bound conditions and focus on high-probability trades. Clarity leads to confidence. Trade confidently and protect your capital effectively with this powerful dashboard. We don't offer free or bonus indicators in exchange of reviews from you.
Quantum TrendPulse
Bogdan Ion Puscasu
5 (26)
SuperTrend   ,   RSI   ,   Stochastic   의 힘을 하나의 포괄적인 지표로 결합하여 트레이딩 잠재력을 극대화하는 궁극의 트레이딩 도구   인 Quantum TrendPulse를   소개합니다. 정밀성과 효율성을 추구하는 트레이더를 위해 설계된 이 지표는 시장 추세, 모멘텀 변화, 최적의 진입 및 종료 지점을 자신 있게 식별하는 데 도움이 됩니다. 주요 특징: SuperTrend 통합:   주요 시장 추세를 쉽게 따라가고 수익성의 물결을 타세요. RSI 정밀도:   매수 과다 및 매도 과다 수준을 감지하여 시장 반전 시점을 파악하는 데 적합하며 SuperTrend 필터로 사용 가능 확률적 정확도:   변동성이 큰 시장에서 숨겨진 기회를 찾기 위해 확률적 진동   을 활용하고 SuperTrend의 필터로 사용 다중 시간대 분석:   M5부터 H1 또는 H4까지 다양한 시간대에 걸쳐 시장을 최신 상태로 유지하세요. 맞춤형 알림:   맞춤형 거래 조건이 충족되면
FX Trend MT5 NG
Daniel Stein
5 (6)
FX Trend NG: 차세대 멀티 마켓 트렌드 인텔리전스 개요 FX Trend NG 는 다중 시간 프레임 기반의 전문 트렌드 분석 및 시장 모니터링 도구입니다. 몇 초 만에 전체 시장 구조를 파악할 수 있도록 설계되었습니다. 여러 차트를 일일이 전환할 필요 없이, 어떤 종목이 추세에 있는지, 어디에서 모멘텀이 약화되고 있는지, 그리고 어떤 시간 프레임이 서로 정렬되어 있는지 즉시 확인할 수 있습니다. 출시 기념 특별 혜택 – FX Trend NG 를 $30 (6개월) 또는 $80 평생 라이선스 로 이용할 수 있습니다. 이미 Stein Investments 고객이신가요? -> 메시지를 보내 전용 고객 그룹에 참여하세요. 설정이나 사용 방법이 필요하신가요? -> Stein Investments 공식 페이지 를 방문하세요. 1. FX Trend NG가 특별한 이유 3단계 추세 로직 – 단순한 Buy / Sell이 아닙니다 • 대부분의 지표는 Buy 또는 Sell 두 가지 상태만 제
제작자의 제품 더 보기
Scan all your favorite pairs with RSI, and get notified on your preferred time frames. Settings are Customizable Click to change time frame or open new pairs Notification: Phone/Popup/Email The relative strength index (RSI) is a technical indicator used in the analysis of financial markets. It is intended to chart the current and historical strength or weakness of a pair/stock based on the closing prices of a recent trading period. The RSI is most typically used on a 14 period, measured on a
The Alligator indicator uses three smoothed moving averages, set at five, eight, and 13 periods, which are all Fibonacci numbers. The initial smoothed average is calculated with a simple moving average (SMA), adding additional smoothed averages that slow down indicator turns. Scan all your favorite pairs with Alligator, and get notified on your preferred time frames. Setting is Customizable Click to change time frame or open new pairs Notification: Phone/Popup/Email
Multi Scanner
Richard Osei
This indicator Allow you to get notification from 7 indicators. Scan all your favorite pairs with your favorite technical indicator, and get notified on your preferred timeframes. Settings are Customizable (RSI, ADX, MACD, Alligator, Ichimoku, Double MA, and Stochastic) Click to change the time frame or open new pairs Notification: Phone/Popup/Email

This is a strategy builder indicator. It consists of almost all the technical indicators. Include notification and Buy/Sell arrows, Automatic Support and Resistance, and Sideways Detection (MT5 version does not include Sideways Detection and only one type of Support and Resistance).  The indicator includes: MACD (Moving Average Convergence Divergence) RSI (Relative Strength Index) Stochastic CCI (Commodity Channel Index) ADX (Average Directional Moving Index) PSAR (Parabolic Stop and Reverse)
My Strategy Scanner (The only indicator you need for forex trading). My Strategy Scanner allows you to create your own strategy and scan all the timeframes, and pairs at the same time. It comes with support and resistance zones, trend lines, and sideways detection. (MT5 version does not include Sideways Detection).  The indicator includes: MACD (Moving Average Convergence Divergence) RSI (Relative Strength Index) Stochastic CCI (Commodity Channel Index) ADX (Average Directional Moving Index) P
A stochastic oscillator is a momentum indicator comparing a particular closing price of a security to a range of its prices over a certain period of time. The sensitivity of the oscillator to market movements is reducible by adjusting that time period or by taking a moving average of the result. It is used to generate overbought and oversold trading signals, utilizing a 0–100 bounded range of values. Scan all your favorite pairs with Stochastic, and get notified on your preferred timeframes. S
This indicator allows you to view multiple timeframes at the same time on the same chart. It will save you time. No need to switch from timeframe to timeframe.  You can see all that is happening in each timeframe on the same chart. Customizable bars to view Customizable bars to Timeframes to view  Customizable bars colors Timeframe views are - M1, M5, M15, M30, H1, H4, D1, W1, and MN
Microsoft Word - Installation - TrendFollower-1 Trend Follower 1 This indicator consists of three key components: an upper band, a lower band, and a middle line. A buy signal is generated when the price closes above the upper band, indicating strong bullish momentum and a potential trend continuation. Conversely, a sell signal occurs when the price closes below the lower band, signaling bearish strength and a possible downward move. The middle line serves as a dynamic support or resistance leve
Microsoft Word - Installation - TrendFollower-2 Trend Follower 2 This trend-following indicator with upper and lower bands is a powerful tool for identifying market momentum and generating trade signals. This indicator consists of three lines: the upper band, lower band, and middle line. A buy signal is triggered when the price closes above the upper band, indicating strong bullish momentum and a potential continuation of the uptrend. Conversely, a sell signal is generated when the price closes
Scan all your favorite pairs with RSI, and get notified on your preferred time frames. Settings are Customizable Click to change time frame or open new pairs Notification: Phone/Popup/Email The relative strength index (RSI) is a technical indicator used in the analysis of financial markets. It is intended to chart the current and historical strength or weakness of a pair/stock based on the closing prices of a recent trading period. The RSI is most typically used on a 14 period, measured on a
This indicator Allow you to get notification from 7 indicators. Scan all your favorite pairs with your favorite technical indicator, and get notified on your preferred timeframes. Settings are Customizable (RSI, ADX, MACD, Alligator, Ichimoku, Double MA, and Stochastic) Click to change the time frame or open new pairs Notification: Phone/Popup/Email

필터:
리뷰 없음
리뷰 답변