Top Bottom Scalper
- Indikatoren
- Version: 2.0
- Aktivierungen: 10
Top Bottom Scalper (MT4-Indikator)
Ein spezielles MT4-Tool, das entwickelt wurde, um ultrapräzise Tops und Bottoms im Markt zu erkennen - perfekt für Forex-Scalping und Händler von binären Optionen, die Präzision und Timing verlangen.
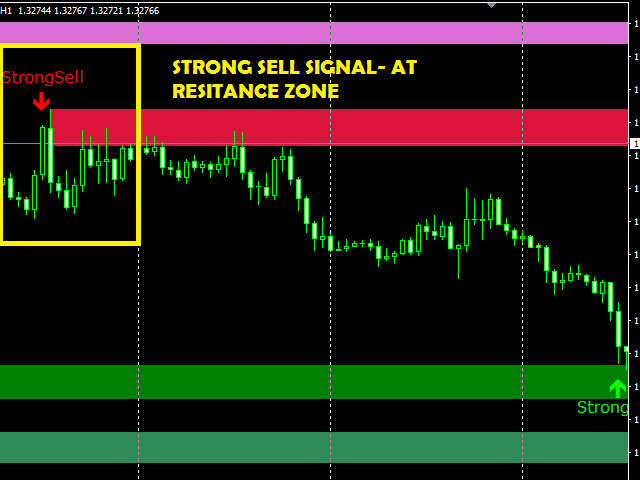
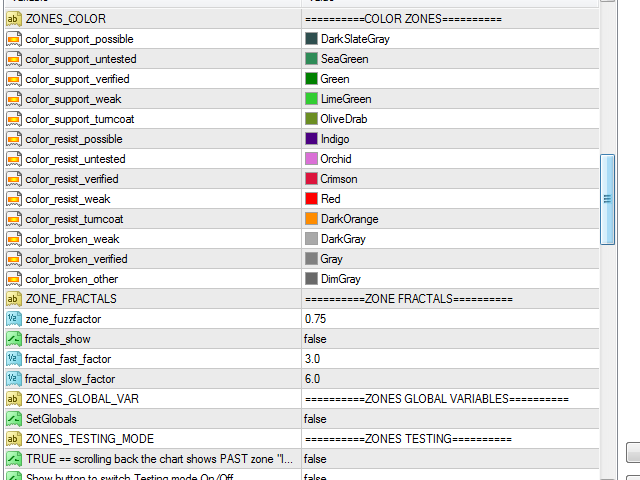
Der Top Bottom Scalper identifiziert wichtige Umkehrpunkte mit außergewöhnlicher Genauigkeit und verstärkt diese Signale durch dynamische Unterstützungs- und Widerstandszonen von unterschiedlicher Qualität.
Egal, ob Sie mit schnellen Umkehrungen oder schnellen binären Setups handeln, dieser Indikator hilft Ihnen, genau in dem Moment einzusteigen, in dem der Preis seine Richtung ändert. Mit einer einstellbaren Signalfrequenz und einer reibungslosen Leistung bei allen Instrumenten passt er sich problemlos an jeden kurzfristigen Handelsstil an.
Warum dieser Indikator Ihnen einen Vorteil verschafft
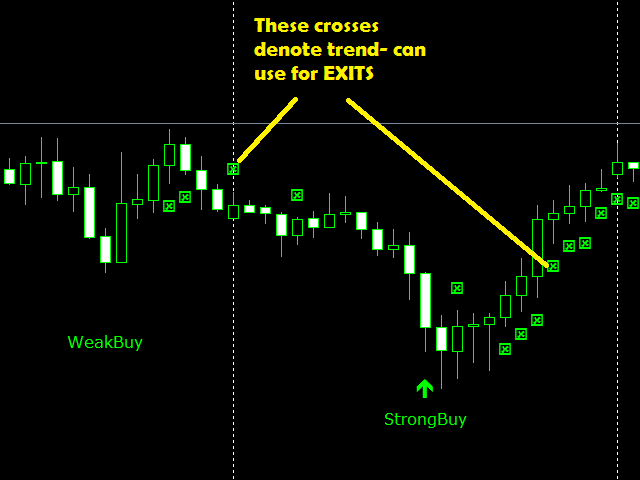
- Präzise Top/Bottom-Erkennung: Findet echte Umkehrpunkte, an denen größere Umschwünge beginnen.
- Forex + Binär bereit: Entwickelt für Forex-Scalping und binäre Optionsstrategien.
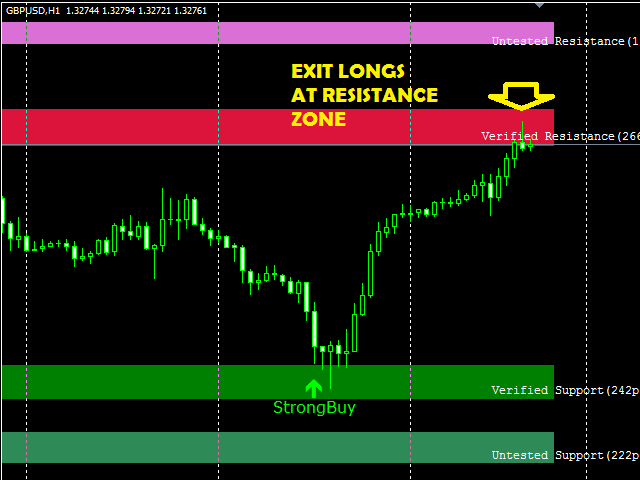
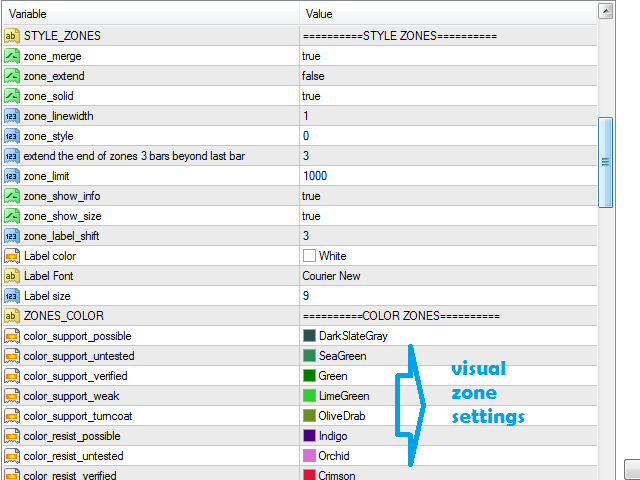
- S/R-Zonen-Integration: Zeigt starke/mittlere/schwache Unterstützung und Widerstand an, um die Stärke der Umkehrung zu bestätigen.
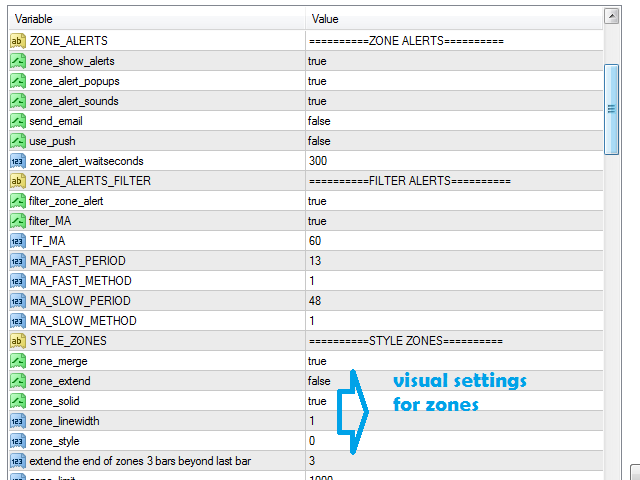
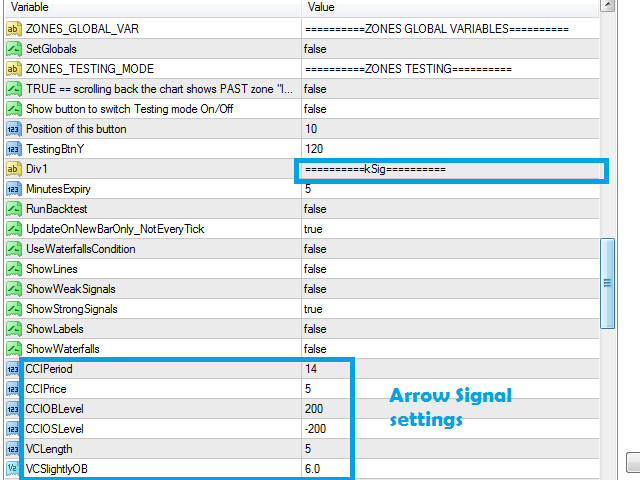
- Einstellbare Signalfrequenz: Steuern Sie, wie oft Signale erscheinen, je nach Ihrer Handelsgeschwindigkeit.
- Funktioniert bei allen Instrumenten: Effektiv für alle Währungspaare, Indizes, Gold, Kryptowährungen und mehr.
- Ideal für den schnellen Handel: Perfekt für Händler, die sofortige, hochwahrscheinliche Einstiegsmöglichkeiten suchen.
Hauptmerkmale des Indikators
- Plattform: MetaTrader 4 (MT4)
- Hauptzweck: Erkennung genauer Marktumkehrpunkte (Höchst-/Tiefststände)
- Handelsanwendungen:
- Forex Scalping
- Binäre Optionen
- Umkehrsignal-Logik:
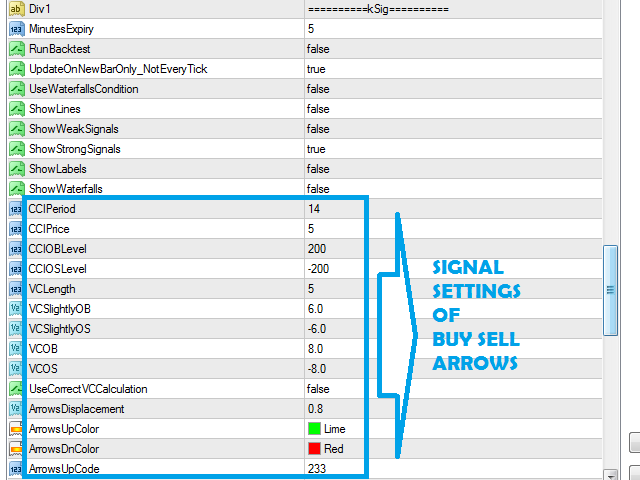
- Generiert Kauf-/Verkaufssignale bei identifizierten Umkehrzonen
- Unterstützungs- & Widerstandssystem:
- Dynamische Zonenerkennung
- Zonenqualitätsstufen (stark, mittel, schwach)
- Hilft zu bestätigen, ob eine Umkehrzone zuverlässig ist
- Signalfrequenzeinstellung:
- Ermöglicht Händlern die Wahl zwischen häufigeren oder selektiveren Einstiegen
- Universelle Kompatibilität:
- Funktioniert auf allen MT4-Handelsinstrumenten
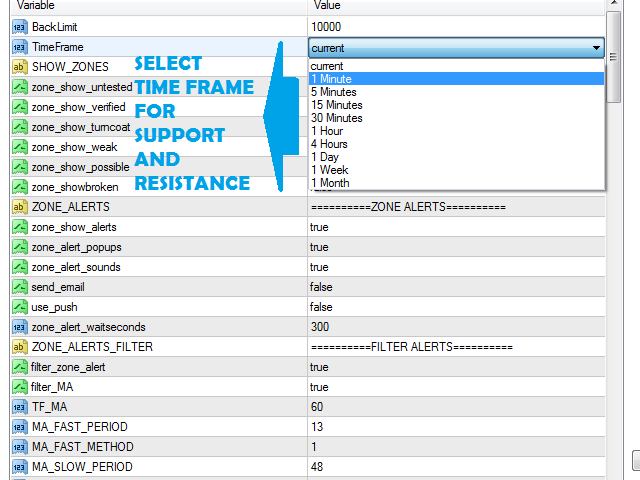
- Geeignet für alle Zeitrahmen
- Neueste Version: 2.0 (20. Dezember 2020)
Warum Händler den Top Bottom Scalper wählen
Dieser Indikator ist ideal für Händler, die sich auf Umkehrungen konzentrieren und schnelle, präzise Einstiege mit klarer visueller Zonenbestätigung wünschen.
Seine Mischung aus präziser Top/Bottom-Erkennung, S/R-Zonen-Qualitätseinstufung und anpassbarer Signalfrequenz macht ihn zu einem leistungsstarken Werkzeug für beständige kurzfristige Gewinne.
Wenn Sie Marktturbulenzen von Anfang an erkennen wollen, ist dieses Tool genau das Richtige für Sie.
Erfassen Sie jede Wende. Holen Sie sich den Top Bottom Scalper noch heute!


Der Benutzer hat keinen Kommentar hinterlassen