Top Bottom Scalper
- インディケータ
- バージョン: 2.0
- アクティベーション: 10
Top Bottom Scalper (MT4 Indicator)
A specialized MT4 tool engineered to pinpoint ultra‑accurate market Tops and Bottoms — perfect for forex scalping and binary options traders who demand precision and timing.
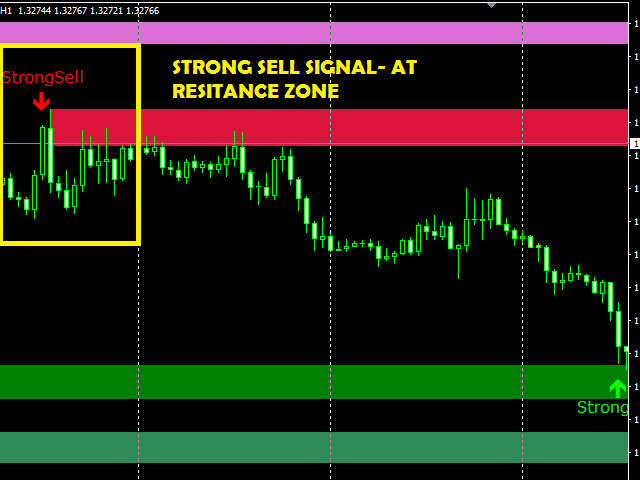
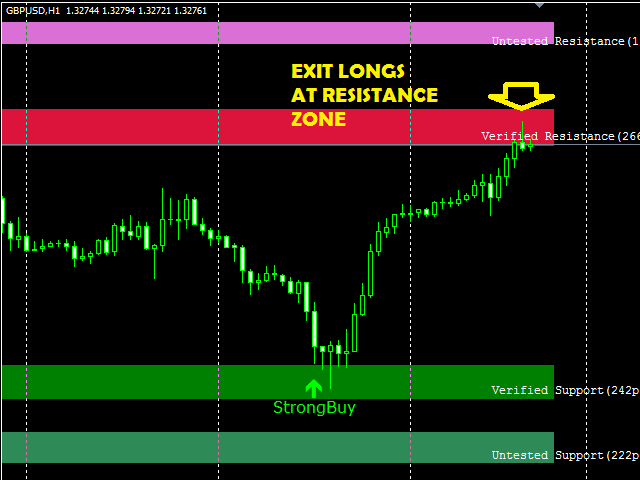
The Top Bottom Scalper identifies major reversal points with exceptional accuracy and strengthens those signals using dynamic Support & Resistance zones of varying quality.
Whether you trade quick reversals or fast binary setups, this indicator helps you enter at the exact moment price shifts direction. With adjustable signal frequency and smooth performance across all instruments, it adapts flawlessly to any short‑term trading style.
Why This Indicator Gives You an Edge
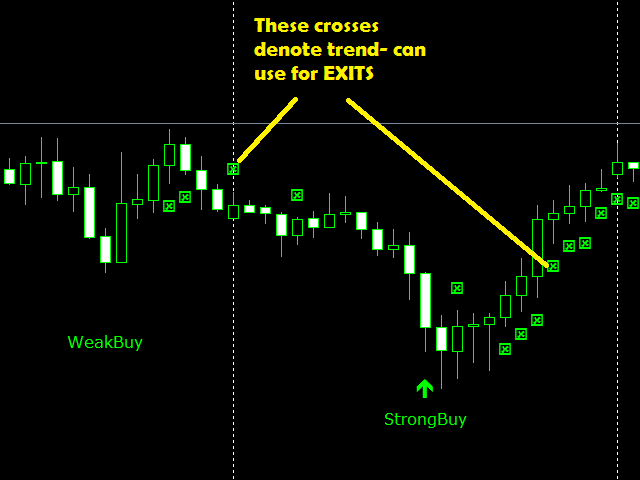
• Precise Top/Bottom Detection: Finds true reversal points where major turns begin.
• Forex + Binary Ready: Designed for both forex scalping and binary options strategies.
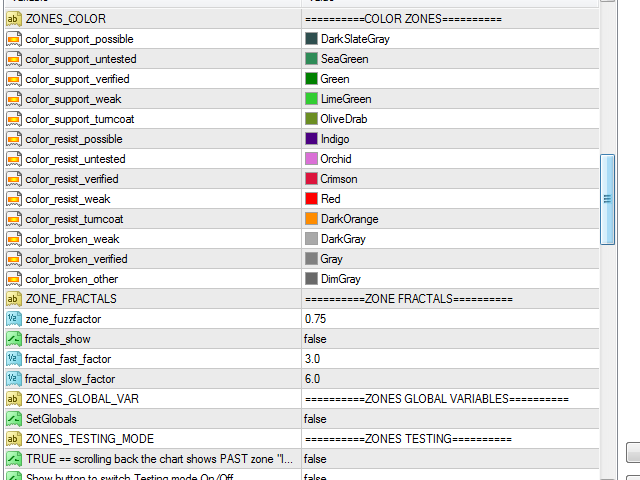
• S/R Zone Integration: Displays strong/medium/weak Support & Resistance to confirm reversal strength.
• Adjustable Signal Frequency: Control how often signals appear based on your trading speed.
• Works on All Instruments: Effective across all currency pairs, indices, gold, crypto, and more.
• Ideal for Fast Trading: Perfect for traders seeking immediate, high‑probability entries.
Key Indicator Features
• Platform: MetaTrader 4 (MT4)
• Primary Purpose: Detects accurate market reversal points (tops/bottoms)
• Trading Applications:
– Forex scalping
– Binary options
• Reversal Signal Logic:
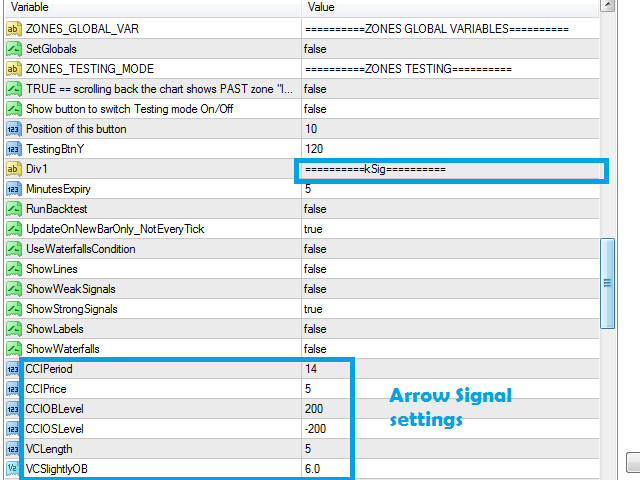
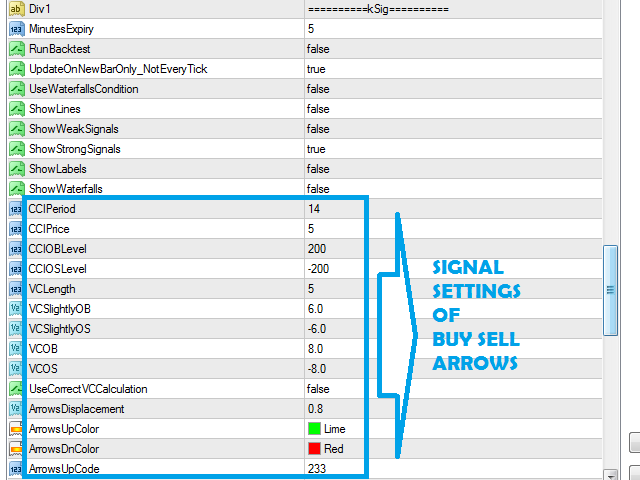
– Generates Buy/Sell signals at identified reversal zones
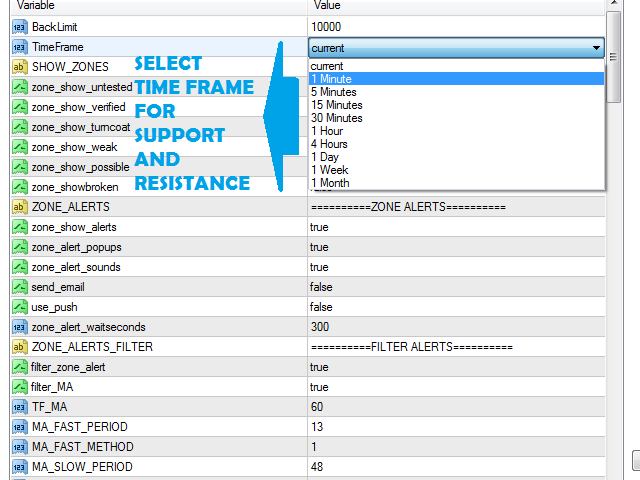
• Support & Resistance System:
– Dynamic zone detection
– Zone quality levels (strong, medium, weak)
– Helps confirm whether a reversal area is reliable
• Signal Frequency Setting:
– Allows traders to choose between more frequent or more selective entries
• Universal Compatibility:
– Works on all MT4 trading instruments
– Suitable for all timeframes
• Latest Version: 2.0 (Dec 20, 2020)
Why Traders Choose the Top Bottom Scalper
This indicator is ideal for reversal‑focused traders who want fast, accurate entries with clear visual zone confirmation.
Its blend of precise top/bottom detection, S/R zone quality grading, and customizable signal frequency makes it a powerful tool for consistent short‑term profits.
If you want to catch market turns at the beginning — this is the tool built for you.
Capture Every Turn. Get the Top Bottom Scalper Today!


ユーザーは評価に対して何もコメントを残しませんでした