Double Trend Signals
- Indikatoren
- Version: 2.0
- Aktivierungen: 10
Double Trend Signals (MT4-Indikator)
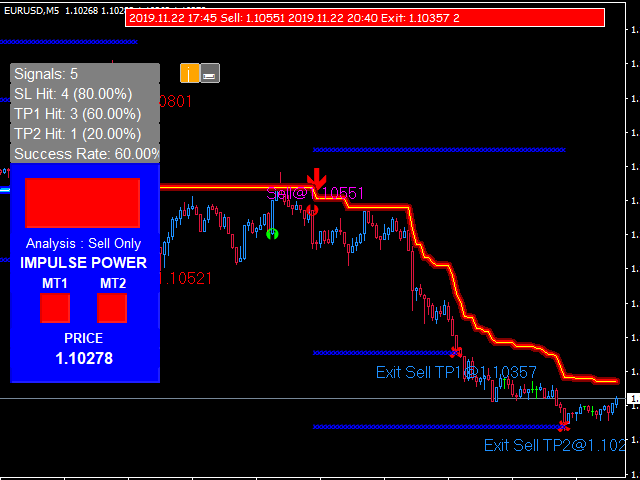
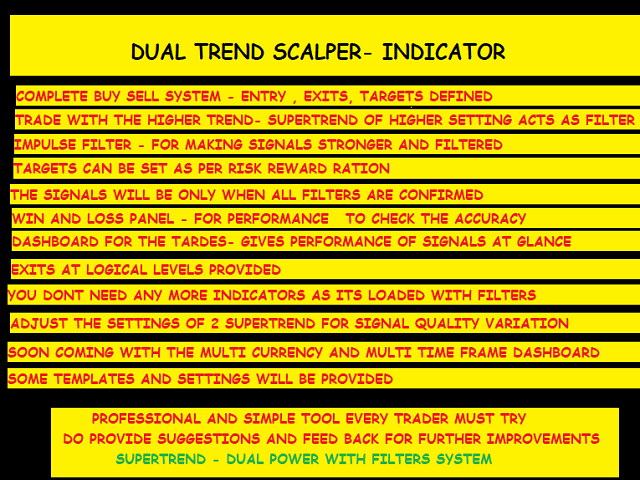
Ein leistungsstarker, nicht nachzeichnender Trendfolge-Indikator, der saubere, visuell intuitive Kaufsignale liefert, die durch intelligente Filterung und zwei Trendbestätigungsebenen unterstützt werden.
Der Double Trend Signals-Indikator vereinfacht den Trendhandel durch die Kombination eines einzigartigen impulsbasierten Trendfilters mit zwei SuperTrend-Bestätigungslayern.
Dieses Multi-Filter-Design stärkt die Signalqualität, filtert Marktgeräusche heraus und bietet Händlern zuversichtlich bestätigte Kaufgelegenheiten.
Jedes Signal wird strikt zum Bar-Close generiert (Shift = 1), was permanente, zuverlässige und nicht wiederholte Einträge garantiert. Mit anpassbaren Statistiken, präzisen Take Profit/Exit-Levels und universeller Marktkompatibilität bietet dieses Tool alles, was für disziplinierten Trendhandel benötigt wird.
Warum Trader Double Trend Signals lieben
- Nicht-übermalende Genauigkeit: Jedes Signal ist dauerhaft - kein Nachzeichnen, Nachzeichnen oder Neuberechnen.
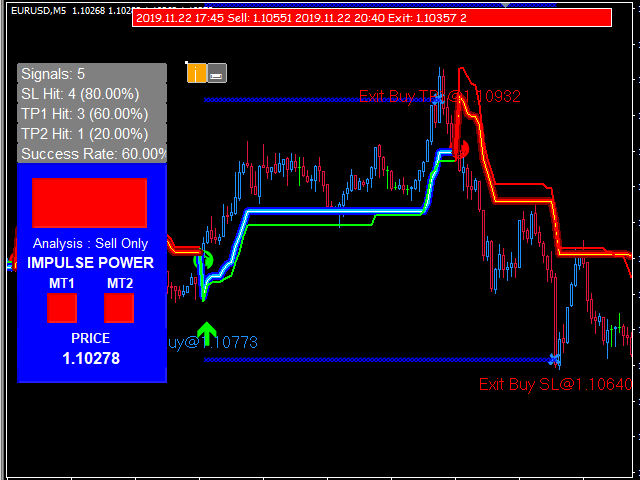
- Visuelle Trend-Klarheit: Das Impuls-Farbfeld zeigt die unmittelbare Trendrichtung und -stärke an.
- Zwei SuperTrend-Filter: Starke zweischichtige Bestätigung reduziert falsche Signale und Marktrauschen.
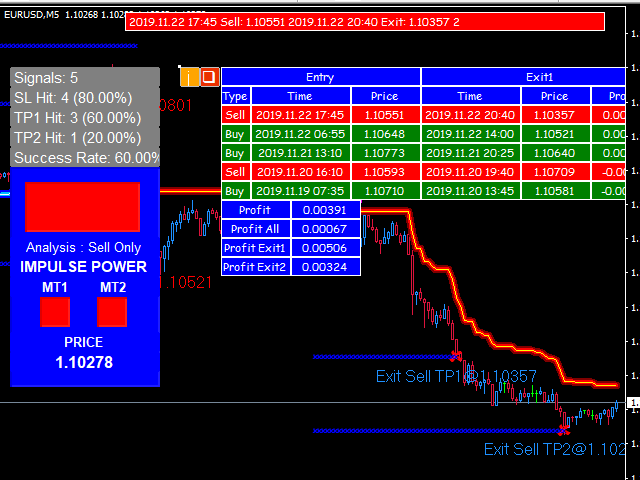
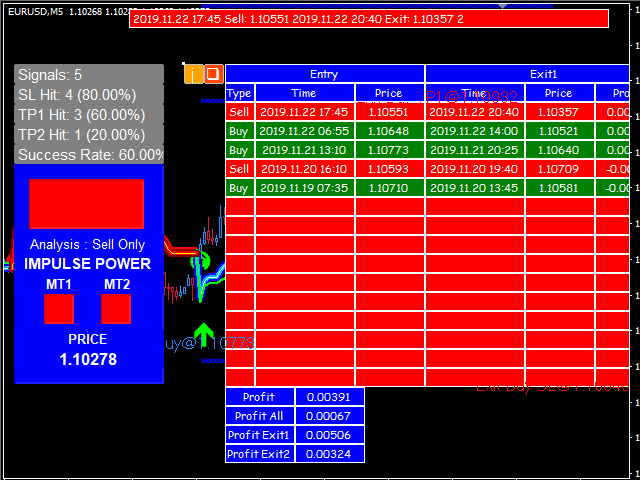
- Verbesserte Strategiepräzision: Eingebaute Statistiken berechnen optimierte Einstiegsniveaus, TP-Zonen und Ausstiegssignale.
- Universelle Kompatibilität: Funktioniert mit allen Symbolen - Forex, Gold, Indizes, Kryptowährungen - und allen Zeitfenstern.
- Vollständiges Alarmsystem: Erhalten Sie sofort Pop-ups, Töne, E-Mail-Warnungen und Push-Benachrichtigungen.
Hauptmerkmale des Indikators
- Plattform: MetaTrader 4 (MT4)
- Hauptzweck: Generierung von Trendfolgesignalen auf der Kaufseite
- Trendvisualisierung:
- Impuls-Farbpanel zur Anzeige der Trendrichtung
- Duale SuperTrend-Filter für mehrschichtige Validierung
- Non-Repainting Engine:
- Signale erscheinen nur bei Kerzenschluss (Shift = 1)
- Garantiert kein Repainting oder Reshaping
- Eingebaute Statistiken:
- Empfohlener Einstiegskurs
- Take Profit Berechnungen
- Exit Signal Logik
- Einstellbare Inputs:
- Entry Parameter Einstellungen
- TP & Exit Konfigurationen
- SuperTrend Verhalten
- Funktioniert auf allen Märkten & Timeframes:
- M1 bis MN1
- Forex, Metalle, Indizes, Krypto, Aktien
- Alarmsystem:
- Pop-up-Benachrichtigungen
- E-Mail-Benachrichtigungen
- Push-Benachrichtigungen (mobil)
- Sound-Benachrichtigungen
- Aktuelle Version: 2.0 (Veröffentlicht am 20. Dezember 2020)
Warum Double Trend Signals wählen?
Dieser Indikator ist perfekt für Händler, die ein sauberes, zuverlässiges, visuell klares Trendfolgesystem suchen.
Seine Kombination aus Impulsfilterung, doppelter SuperTrend-Bestätigung und nicht nachzeichnender Präzision macht ihn äußerst effektiv für die Verbesserung der Einstiegsqualität und die Steigerung der Rentabilität.
Wenn Sie Kaufsignale wünschen, die einfach, zuverlässig und vollständig bestätigt sind - dieses Tool liefert genau das.
Meistern Sie den Trendhandel mit Zuversicht. Holen Sie sich den Double Trend Signals Indicator noch heute!