Wave Size into ZigZag
- Indikatoren
- Version: 1.0
- Aktivierungen: 5

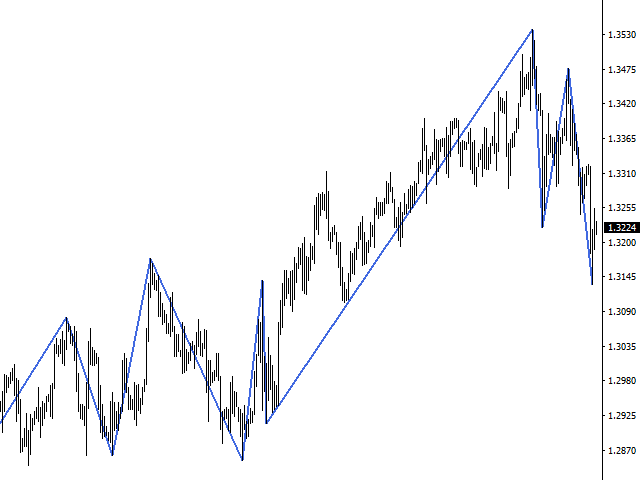
Zigzag wird durch Preiswellen gebildet, deren Größe nicht geringer ist als die in den Einstellungen festgelegte Größe. Der Indikator ist nicht in der Lage, zwei Tops (Maximum und Minimum) auf einer Kerze zu zeichnen, daher sollten Sie kleinere Zeitrahmen des Charts verwenden, um die Wellen kleinerer Größe zu bestimmen. Sie können das Zickzack als Histogramm hier herunterladen.
Um Statistiken über die Größe der Preiswellen zu sammeln, verwenden Sie den IndikatorWave Size Stats.
PARAMETER
- MinWaveSize: die minimale Wellengröße, auf der die nächste Schulter des Zickzackkurses gebildet wird.