Hidden Breakout Power
- Indikatoren
- Version: 1.0
- Aktivierungen: 5

Versteckte Ausbruchskraft
Der Markt hat einen Zyklus, bewegt sich immer wieder von: BEREICH -> AUSBRUCH -> TREND -> KONSOLIDIERUNG -> BEREICH
RANGE und TREND Die beiden wichtigsten Staaten, während die BREAKOUT beziehen sich auf den kurzen Zeitraum des Marktes brechen den Bereich, CONSOLIDATION beziehen sich auf die lange Konsolidierung des Marktes und schrumpfen auf Bereich. In der Regel oszillierende Indikator führt gut in RANGE-Zustände und schlecht in Trend-Zustand, während TREND-Indikator ist der umgekehrte Weg, es führt in einem TREND-Zustände und aber schlecht in RANGE-Zustände. Daher ist die Identifizierung der Marktzustände der Schlüssel zum Erfolg. Insgesamt ist der BREAKOUT des Marktes der gefährlichste und führt zu vielen Kontoexplosionen. Da er in einem sehr kurzen Zeitraum stattfindet, ist es für Breakout-Trader schwierig, diesen spannenden Moment zu erwischen.
Wichtigste Merkmale
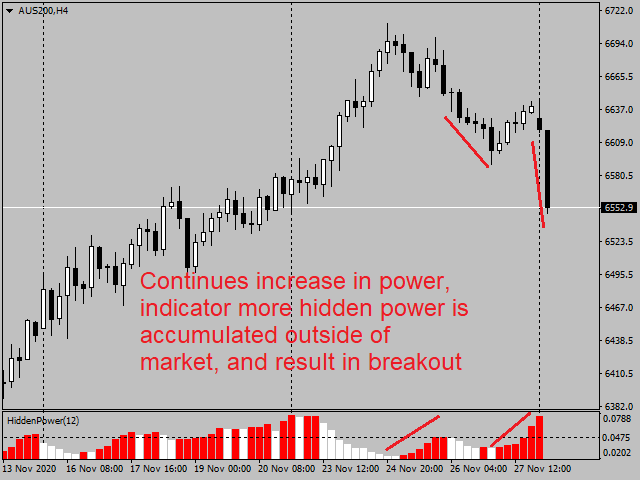
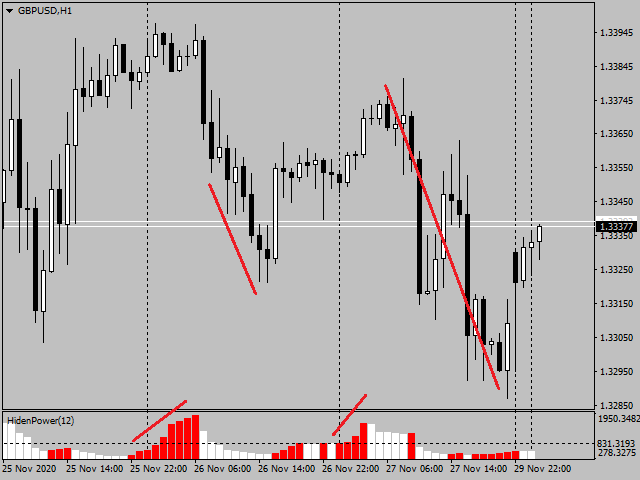
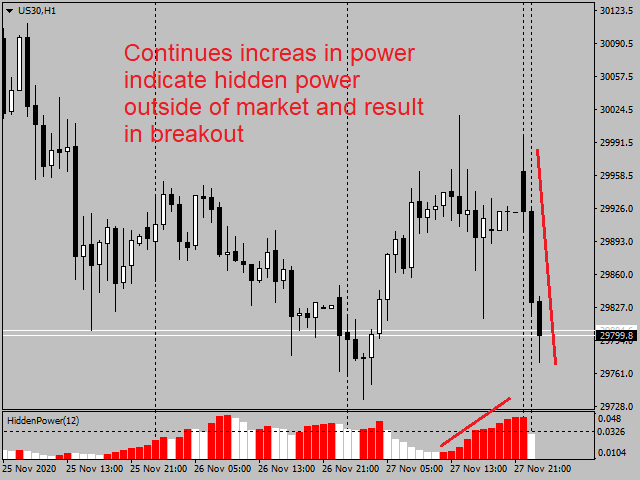
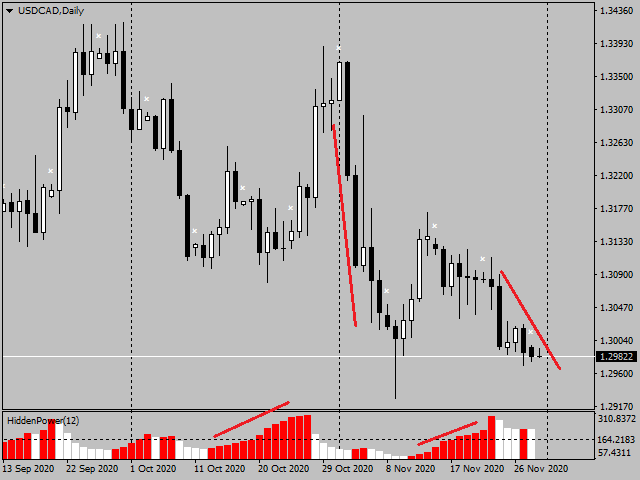
Hidden Breakout Power ist ein einfacher Indikator, der entwickelt wurde, um den Markt BREAKOUT zu erkennen. Wie der Name schon sagt, misst er die verborgene Kraft außerhalb des Marktes und wird in einem roten Histogramm angezeigt, während sein Wert ansteigt. Wenn der Wert hoch ist, bedeutet dies, dass eine hohe Kraft außerhalb des Marktes verborgen ist und der Markt bereit für einen Ausbruch ist. Wenn der Wert niedrig ist, bedeutet dies, dass der größte Teil der Marktmacht innerhalb des Marktes liegt, Long- und Short-Power bekämpfen sich gegenseitig, daher bedeutet ein niedriger Wert nicht, dass die Volatilität des Marktes gering ist, während ein hoher Wert bestätigt, dass ein zukünftiger Ausbruch bald bevorsteht.
Er wird im H1 und H4 Zeitrahmen durchgeführt.
Parameter
Es gibt nur einen Parameter, den Zeitraum, den Sie wählen können, um den Zeitraum für die versteckte Macht zu erkennen.
Empfohlene Handelsstrategie
- Wählen Sie die Produkte mit großen Schwankungen und starkem Trendcharakter, z.B. GBPUSD, USDCAD, NASDAQ, OIL, etc.
- Wenden Sie den Indikator auf das H1- oder H4-Diagramm für ein beliebiges Produkt an .
- Wenn das Histogramm einen niedrigen und weißen Wert anzeigt, handeln Sie nicht, sondern warten Sie geduldig.
- Wenn das Histogramm rot wird und sein Wert steigt, machen Sie sich bereit für eine Ausbruchsstrategie.
- Wenn das Histogramm über einen längeren Zeitraum ansteigt, überprüfen Sie Ihren Finanzkalender, um das Ereignis zu bestätigen, und platzieren Sie eine Stop-Order auf beiden Seiten des Marktes.
- Wenn der Markt ausbricht, wird der Indikator schnell zu einem niedrigen Wert und weiß, machen Sie Close-Order.
- Niedriger Wert kann auch Indikatoren für den Trend, 50% Chance, es kann auch sein, große Fluktuation, beobachten Sie sorgfältig.
Bitte geben Sie Ihr wertvolles Feedback für mich, um den Indikator zu verbessern.