Colored Chaikin Money Flow
- Indikatoren
- Version: 2.0
- Aktivierungen: 5

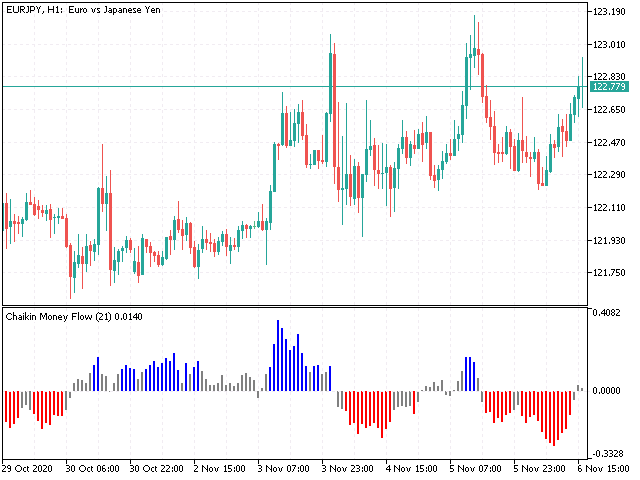
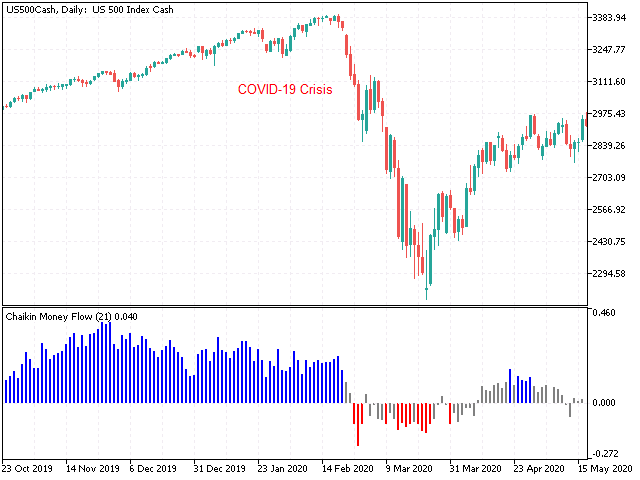
Der Chaikin Money Flow (CMF) ist ein Indikator, der in den 1980er Jahren von Marc Chaikin entwickelt wurde, um die Anhäufung und Verteilung einer Aktie über einen bestimmten Zeitraum zu überwachen. Der Standardzeitraum für den CMF beträgt 21 Tage. Die Werte des Indikators liegen zwischen +1 und -1. Jede Kreuzung über oder unter 0 kann zur Bestätigung von Veränderungen im Geldfluss sowie von Kauf- oder Verkaufsimpulsen verwendet werden, aber viele Händler suchen nach Divergenzen, um Trendumkehrungen auf der Grundlage des Volumens vorherzusagen.
Dieser Indikator wurde nicht nur für manuelle Trader entwickelt, sondern auch für Expert Advisors, die seine Farbveränderungen lesen können und schnelle Berechnungen für optimierte Backtests benötigen.
DER CHAIKIN MONEY FLOW IST KEIN EIGENSTÄNDIGES TOOL.
Für Algos:
Farbpuffer Nr. 1;
Farben: 0 - Rot; 1 - Blau; 2 - Grau.