MACDmaxmin
- Indikatoren
-
Carlos Andrés Moya Erazo
 I am an Electronic Engineer specializing in Automation and Control with 15 years of experience, a multi-platform and multi-language programmer for over 20 years, and an enthusiastic trader since 2018. Throughout my career, I have combined my expertise in efficient process automation, intelligent
 - Version: 2.0
- Aktualisiert: 27 März 2025
- Aktivierungen: 10
Der Indikator zeigt an, wenn es zu Überpreisen und Divergenzen gegenüber einem normalisierten MACD
Außerdem zeigt er Signale mit konfigurierbaren Alarmen, selbstregulierenden dynamischen Überpreisniveaus und einer einfachen Einrichtung und Schnittstelle an.
Der Indikator, der automatisch die Überpreisungsbereiche berechnet!
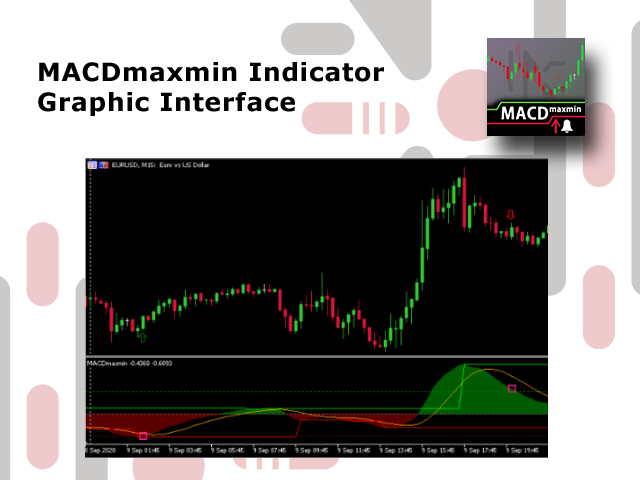
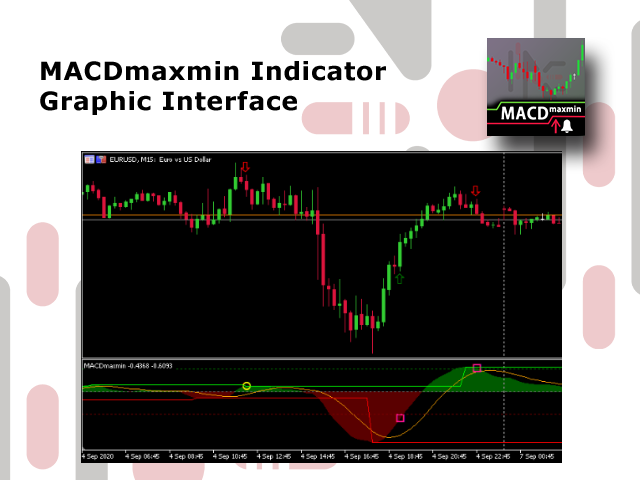
MACDmaxmin ist ein auf dem MACD-Oszillator basierender Indikator, der Trendänderungen im Preis effektiv identifiziert, da er ein Momentum-Indikator ist, der den Trend erfasst und die Beziehung zwischen zwei gleitenden Durchschnitten des Preises anzeigt.
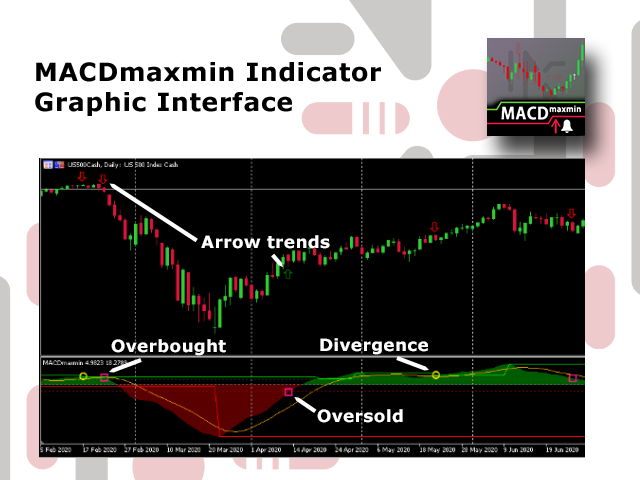
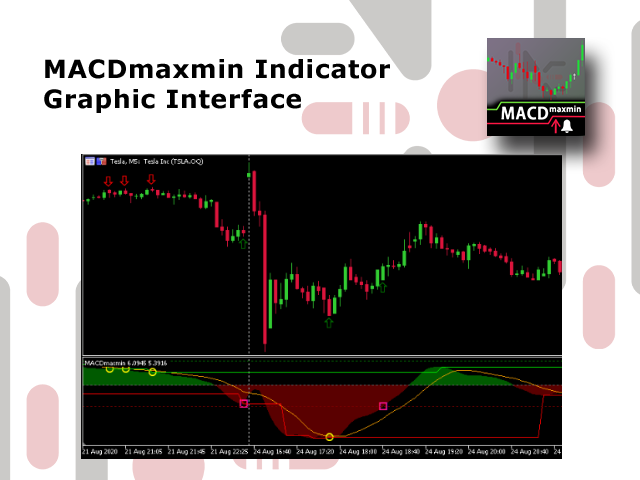
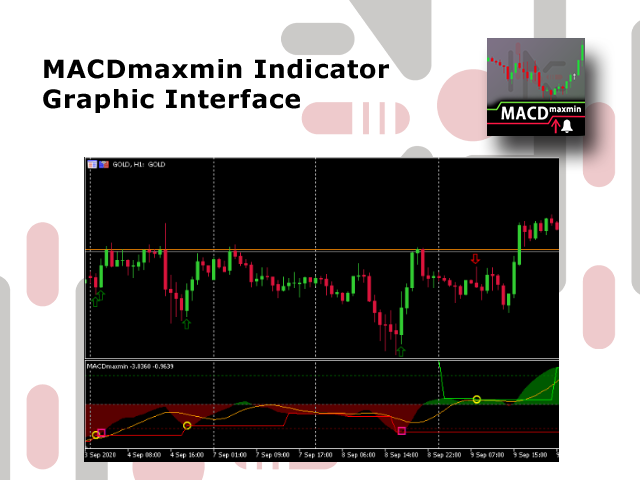
Der MACDmaxmin liefert wertvolle Marktinformationen und Signale für Übertreibungen und Divergenzen, die er automatisch erkennt. Diese Signale werden im Oszillator als Kreise für die Divergenzpunkte und als Quadrate für die Überpreispunkte dargestellt. Sie können sofort konfigurierbare Warnungen für diese Signale erhalten.
Darüber hinaus hat dieser Indikator zwei einzigartige Eigenschaften
Er stellt dynamische Unterstützungs- und Widerstandsniveaus dar, die er automatisch in Abhängigkeit von dem Markt, auf den er angewendet wurde, und den vom Händler bequem konfigurierten Eingabeparametern berechnet. Überkaufte und überverkaufte Niveaus werden ebenfalls automatisch für jeden Chart berechnet, um die Ergebnisse zu optimieren.
Die zweite Besonderheit des MACDmaxmin besteht darin, dass er normalisierte Werte auf einer Skala von -100 bis 100 anzeigt, um einen umfassenden Überblick über die tatsächliche Bewegung des Marktes zu erhalten.
MACDmaxmin Merkmale
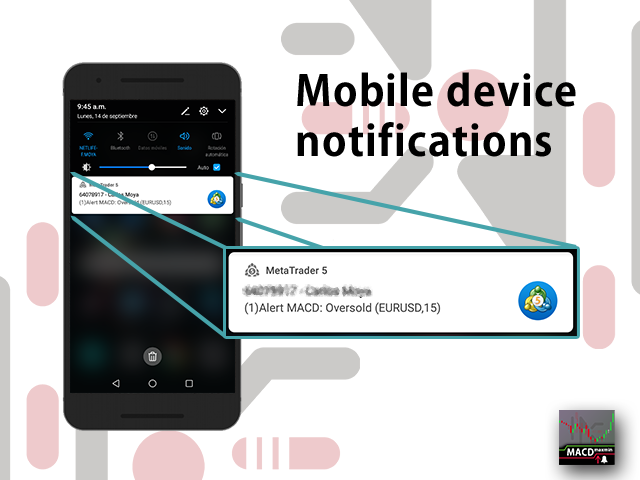
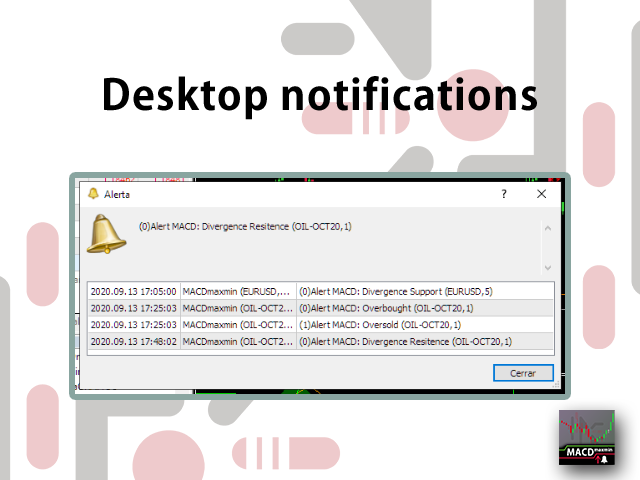
- Der Indikator ermöglicht die Generierung von Alarmen in verschiedenen Konfigurationen (mobile Anwendung - Push, E-Mail, Desktop-Anwendung), wenn Divergenzen und Überbewertungen erkannt werden
- Alarme können für dasselbe Ereignis wiederholt werden, um den MACDmaxmin-Indikator zu garantieren oder zu erkennen
- Der Indikator vereinfacht die Parameter auf das Maximum, um dem Trader komplexe Konfigurationen zu ersparen
- Der Indikator ist für jeden Vermögenswert und jeden Zeithorizont gültig
- Er kann in Strategien verwendet werden, die nur auf diesem Indikator basieren, oder er kann mit anderen Indikatoren kombiniert werden
- Sie können die Farbe der Trendlinien des Indikators konfigurieren.
- Optimierter und getesteter Algorithmus, um sicherzustellen, dass er immer einsatzbereit ist
Versteht:
- Einen positiven und einen negativen Bereich, der die MACD-Bewegung darstellt
- Oszillierende Linie als Signal für die Trendstärke
- 2 Linien dynamischer Niveaus von Unterstützungen und Widerständen im Oszillatorsignal
- Zwei Linien von dynamischen Niveaus, Widerstand und Unterstützung
Parameter des MACDmaxmin-Indikators
- Schnelle MACD-Periode Candlestick-Periode, die zur Berechnung des schnellen gleitenden Durchschnitts des MACD-Oszillators verwendet wird
- Langsame MACD-Periode Candlestick-Periode, die zur Berechnung des langsamen gleitenden Durchschnitts des MACD-Oszillators verwendet wird
- Signal Periode Periode zur Berechnung des MACD-Signals
- Toleranzwert, der als Bedingung verwendet wird, um einen Höchstwert als neues Maximum oder Minimum zu akzeptieren
- Kind Preisberechnung kann alle Formen der Preisberechnung einschließlich HL / 2, HLC / 3 und HLCC / 4 verwenden
- Ansicht Divergenz (Kreis) Anzeige von Kreisen im Oszillator an den Punkten, an denen Divergenzen aufgetreten sind
- Ansicht Überpreis (Quadrat) Anzeige im Oszillator Quadrate an den Punkten, an denen Überpreise festgestellt werden
- Trend im Chart anzeigen (Pfeil): Im Candlestick-Chart wird ein Pfeil angezeigt, der den möglichen Trend gemäß dem Oszillator RSImaxmin angibt.
- Ansicht der Unterstützungs- und Widerstandsniveaus Ansicht der automatisch berechneten Unterstützungs- undWiderstandsniveaus
- Inden Alarmeinstellungen können Sie die Alarme auswählen, die Sie in Bezug auf den Indikator erhalten möchten. Diese können sein:
- alerts_off
- maxmin_Abweichungen
- max_Abweichungen
- min_Abweichungen
- überkauft
- überverkauft
- überkauft_verkauft
- alle_Warnungen
- Alert Art sind die Optionen, die das Programm erlaubt, um Sie über ein Ereignis zu informieren. Diese können sein:
- Mobile (Sie müssen diese Option auf Ihrer MT5-Plattform aktiviert haben)
- E-Mail (Sie müssen Ihre MT5-Plattform für den Empfang von E-Mails konfigurieren)
- Desktop
- Alle
- DieAlarmwiederholung pro Ereignis gibt an, wie oft ein Alarm für dasselbe Ereignis wiederholt werden kann. Sie können einen Alarm je nach Bedarf 1, 3, 5 oder 10 Mal wiederholen.
Wenn Sie Fragen oder Anregungen haben, können Sie mich unter folgender Adresse kontaktieren: link


Ótimo indicador, recomendo.