Histogram DMI with Oscillator ADX
- Indikatoren
-
Catalin Adelin Iovan
 In my world 2 + 2 can be 5
If you have an idea and want your custom strategy or indicator coded, let me know. - Version: 1.0
- Aktivierungen: 5
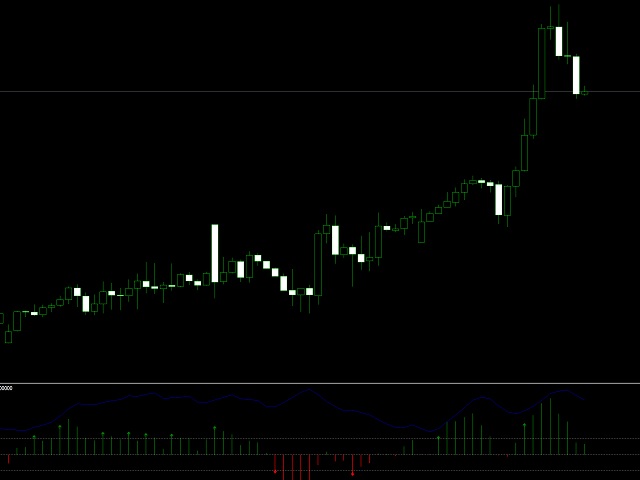
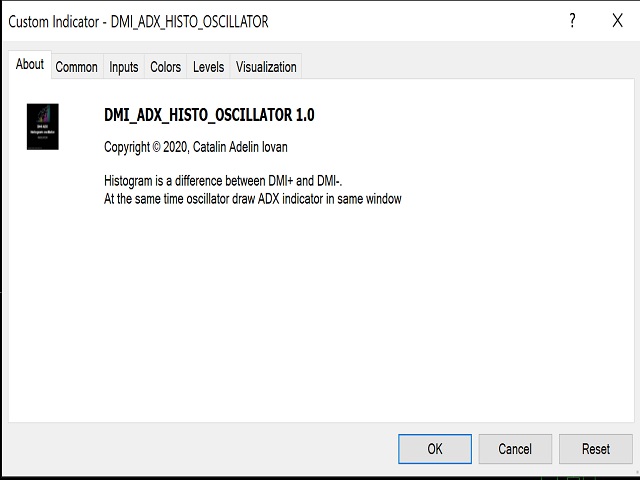
DMI ADX Histogramm Oszillator
Ich präsentiere Ihnen einen der präzisesten und leistungsfähigsten Indikatoren
Er besteht aus dem DMI Histogramm und dem ADX Oszillator. Er hat einen inneren Pfeil, der ein Kauf- oder Verkaufs-Setup anzeigt.
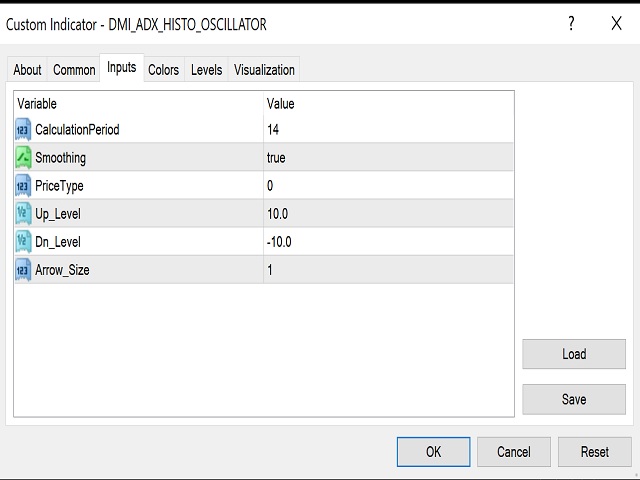
Eigenschaften
Die Funktionsweise ist die folgende: das Histogramm ist ein Unterschied zwischen DMI+ und DMI-. Gleichzeitig haben wir den Oszillator ADX für
Markt zu laufen
Es kann an alle Arten von Handelsstilen wie Scalping, Daytrading oder Swing angepasst werden. Es spielt keine Rolle, ob es Forex, Aktien, Krypto und so weiter. Es kann angepasst und optimiert werden, um alle von ihnen.
Kontakt
Für jede Frage, die Sie haben, fühlen Sie sich frei, mich wissen zu lassen
Logo erstellt von https://www.fiverr.com/aleksa19