Range Detector MT5
- Indikatoren
- Version: 7.30
- Aktivierungen: 5

Beschreibung
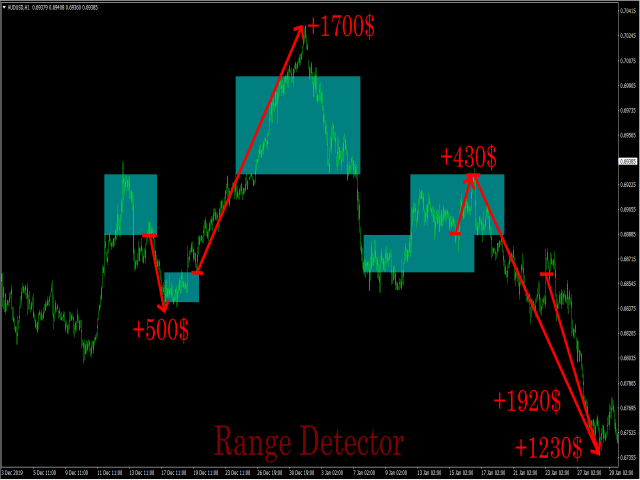
Range Detector ist ein Indikator, der Handelsspannen im Markt identifiziert und deren Vorhandensein im Preisdiagramm anzeigt.
Empfehlungen
Sie können diesen Indikator verwenden, um die Spanne zu bestimmen und dementsprechend die Richtung der Eröffnung einer Position oder der Schließung einer entgegengesetzten Position zu bestimmen.
Parameter
Maximum History Bars - maximale Anzahl von History Bars für die Berechnung des Indikators.
Average True Range Period - Periode des ATR-Indikators (wird zur Berechnung der Differenz zwischen gleitenden Durchschnitten verwendet).
Schnelle gleitende Periode - Periode des schnellen gleitenden Durchschnitts.
Langsam gleitende Periode - Periode des langsam gleitenden Durchschnitts.
Movings Difference - Mindestdifferenz zwischen gleitenden Durchschnitten (für die Impulssuche), ausgedrückt in der Anzahl der ATR-Werte.
RangesColor - Farbe der Bereiche.