HelpTrader to Enter the Market
- Indikatoren
-
Mikhail Bilan
 Good afternoon friends! If for some reason you ended up on my profile, then you are in luck) After all, here you will find a good product in the form of an indicator and signals from me.
 - Version: 1.7
- Aktivierungen: 15
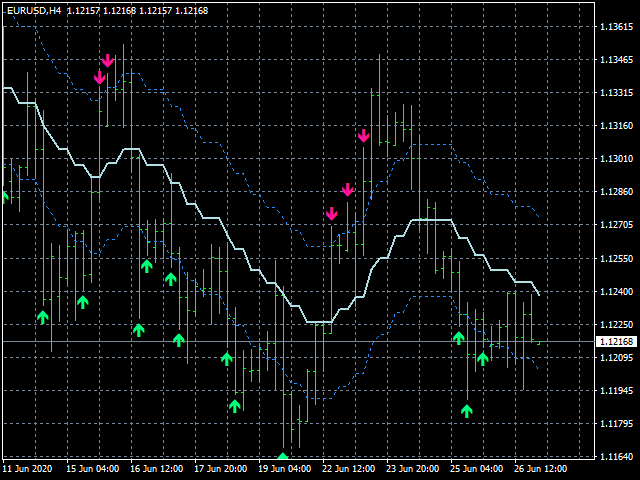
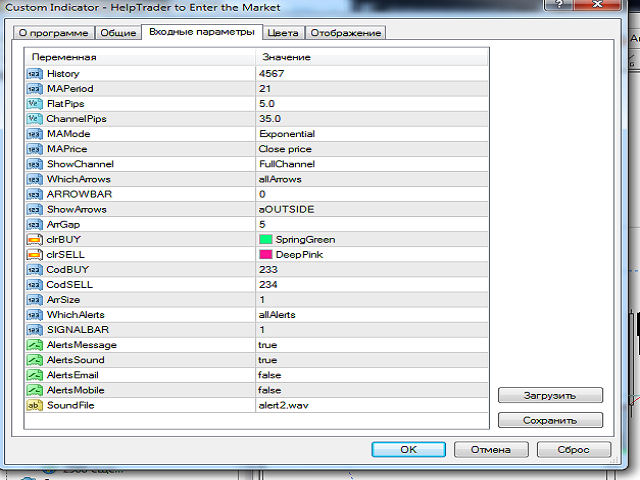
MERKMALE DES INDIKATORS HELPTRADER ZUM EINSTIEG IN DEN MARKT
! vier Arten von gleitenden Durchschnitten für den Aufbau eines Kanals;
! die Möglichkeit, die Breite der Wohnung (Central MA) und die Marge für die Kanalgrenzen zu wählen;
! vier Optionen für die Anzeige des Kanals;
!drei Einstellungen für das Aussehen des Pfeilsignals;
!anpassbares Benachrichtigungssystem.
Der Pfeil-Kanal-Indikator HelpTrader, um den Markt, aufgrund seiner Variabilität, kann ein ziemlich effektives Instrument für den Handel in Kombination mit anderen Indikatoren werden.