HelpTrader to Enter the Market

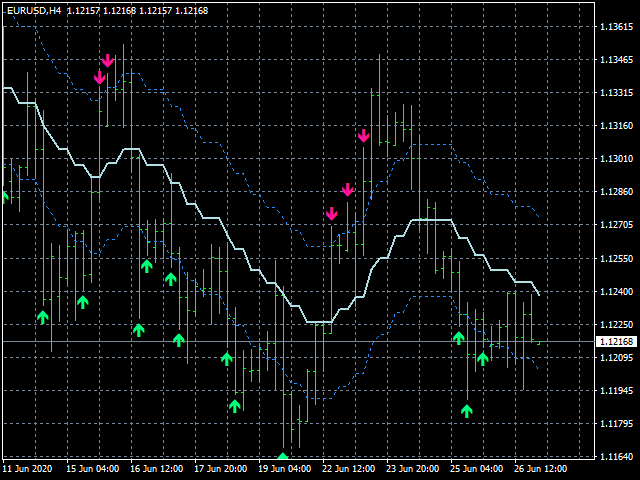
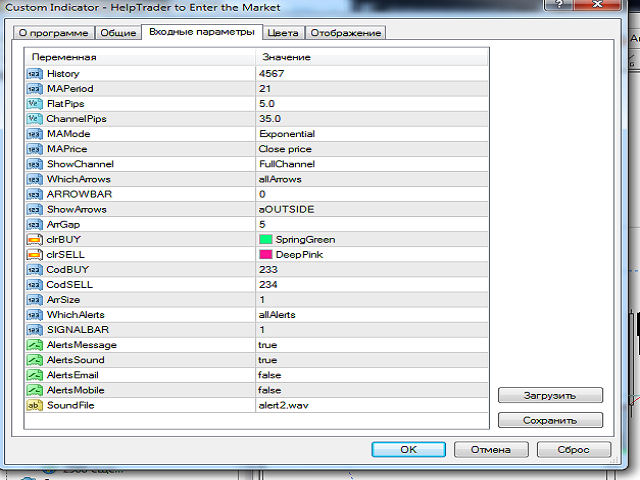
FEATURES OF THE HELPTRADER TO ENTER THE MARKET INDICATOR
! four types of moving averages for building a channel;
! ability to select the width of the flat (Central MA) and the margin for the channel borders;
! four options for the display channel;
! three settings for the appearance of the arrow signal;
!customizable notification system.

The arrow channel indicator HelpTrader to Enter the Market, due to its variability, can become a fairly effective tool for trading in combination with other indicators. 


추천 제품
Fibonacci Auto Levels
Mohamed yehia Osman
Possible Price reversals levels - based on  Fibonacci + Support +  Resistance Levels Auto levels drawn based on input index (Bars Count )  ---->>> Price Over 50% Fibo line ---> UP TREND ---> BUY when price drop near Support Lines  ---->>> Price Down 50% Fibo line ---> DOWN TREND ---> SELL when price goes up  near Resistance Lines  --->>> The more close price levels ----> the more possibility for price reversals --->>> are you a scalper --> try it on M1 charts with big index like 5000 bars  or
NO REPAINT ADVANCED CHART PATTERN INDICATOR By definition, a price ( chart)  pattern is a recognizable configuration of price movement that is identified using a series of  trendlines  and/or curves. When a price pattern signals a change in trend direction, it is known as a reversal pattern; a continuation pattern occurs when the trend continues in its existing direction following a brief pause. Advanced Chart Pattern Tracker is designed to find the MOST ACCURATE patterns. A special script is a
The indicator draws trend lines based on Thomas Demark algorithm. It draws lines from different timeframes on one chart. The timeframes can be higher than or equal to the timeframe of the chart, on which the indicator is used. The indicator considers breakthrough qualifiers (if the conditions are met, an additional symbol appears in the place of the breakthrough) and draws approximate targets (target line above/below the current prices) according to Demark algorithm. Recommended timeframes for t
Overview: The Linear Regression Channel Indicator is a versatile tool designed for Metatrader to help traders visualize price trends and potential reversal points. By calculating and plotting linear regression channels, bands, and future projections, this indicator provides comprehensive insights into market dynamics. It can highlight overbought and oversold conditions, identify trend direction, and offer visual cues for future price movements. Key Features: Linear Regression Bands: (   fig
Bento Market Structure
Gede Hendra Saputra
Overview Automated smart money market structure identification following smart money concept and inner circle trader concept, it gives an unprecedented edge on your smart money and market structure analysis by automatically identifies valid market structure using smart money concept: Identify impulsive and corrective moves Identify valid pullbacks built by impulsive and corrective market moves Idenitfy bearish or bullish leg and their inducements for smart money concept Identify valid market st
스페셜 오퍼 : ALL TOOLS , 각 $35 에 구매 가능! New tools   will be   $30   for the   first week   or the   first 3 purchases !  Trading Tools Channel on MQL5 : Join my MQL5 channel to update the latest news from me 변동성이 큰 트레이딩 환경에서 강력하고 직관적인 분석 도구는 신속하게 기회를 포착하는 데 도움이 됩니다. Fibonacci Trend Scanner는 전통적인 피보나치(Fibonacci) 지표 기능과 SuperTrend를 통합할 뿐만 아니라, 통화쌍 스캔, 멀티 타임프레임 모니터링, 그리고 추세가 상승세에서 하락세로(또는 반대로) 전환될 때 인텔리전트 알림을 제공하도록 기능을 확장하였습니다. See more MT5 version at:   Fibonacci Trend MT5 Scanner See more products a
Contact me for instruction, any questions! Introduction Chart patterns   are an essential tool traders and investors use to analyze the future price movements of securities. One such pattern is the triple bottom or the triple top pattern, which can provide valuable insights into potential price reversals. This pattern forms when a security reaches a low   price level   three times before reversing upward or reaches a high price level three times before reversing downward.   Triple Top Bottom P
Trend Divergence Indicator: Your Essential Tool for Market Analysis The Trend Divergence Indicator is a powerful tool designed to assist traders in identifying market trends and pinpointing entry points with precision. By leveraging price divergence, this indicator enhances your trading strategy, offering reliable insights and filtering unnecessary signals. Key Features and Benefits of the Trend Divergence Indicator Accurate Trend Analysis: The Trend Divergence Indicator uses price divergence t
" ZigZag on Trend " 지표는 가격 움직임 방향을 파악하는 데 도움이 되는 지표이며, 막대 및 핍 계산기 기능도 제공합니다. 이 지표는 추세 지표, 가격 방향을 추적하는 지그재그로 표현된 추세선, 그리고 추세 방향으로 지나가는 막대 수와 수직선의 핍 수를 계산하는 카운터로 구성됩니다(계산은 막대의 시작점을 기준으로 합니다). 이 지표는 다시 채색되지 않습니다. 편의상 색상이 있는 막대 또는 선으로 표시됩니다. 모든 시간대에서 사용할 수 있지만, M5 이상에서 사용하는 것이 가장 좋습니다. " Period "은 가격 방향을 검색할 막대 수를 결정합니다. 한 방향으로 완만한 추세를 얻기 위해 방향의 길이를 계산합니다. " Diapason "는 추세 방향의 빈도를 조정하며, 주로 다양한 거래 상품의 첫 번째 매개변수를 조정합니다(EURUSD의 경우 최대 10개, GOLD의 경우 최대 100개). 핍 카운터는 모든 시간대 및 거래 상품에 대한 조정을 지원합니다. 주요 지표
The Auto Super Pivot indicator is an indicator designed to calculate support points and resistance points for pivot points. this indicator has the ability to calculate standard pivot, fibonacci, camarilla, woodie and demark pivot points. It also allows you to use all time zones with the time frame feature. Another feature of the indicator is the auto time slice feature. This feature allows automatic calculations without having to set any time zone. Features 6 different pivot calculation modes A
Cosmic Diviner Big Deals System
Olena Kondratenko
4.2 (5)
This is a unique multi-currency trading strategy developed for trading on H1 timeframe, which allows you to determine the global market entry points and obtain the maximum profit for each transaction. The market entry point is calculated using a variety of author equations and algorithms. We recommend using the indicator simultaneously on several trading instruments . A huge advantage of Big Deals System is an information panel in which the user can see the current information on potential entry
Moving Wizard
Jefr Alnafey
Moving Wizard indicator will guide you to work with Trend and give pure Entry point depending on crossing on the chart it work on all currency and all Timeframe you can use it daily or scalping or swing its good with all and This indicator you can make it your strategy  i work on it on H1 Timframe and make a good money you can take alook on it and you see a great resault on chart  .Gold moving is to Know the Trend of price other moving below it mean we looking to sell orders . if above it we loo
King Trend Pro
Nguyen Cong Hoan
Key Features: Instant BUY/SELL Signals with clear entry levels 3 Take Profit Levels (TP1, TP2, TP3) – customize your risk/reward Dynamic Stop Loss based on market structure Trendline Breakout Logic – detects breakout confirmation automatically Real-time Signal Notifications (alerts, emails, push notifications) Works on all timeframes (M5 to D1 recommended) Compatible with all Forex pairs, gold, indices, and crypto How it works: Wait for a BUY or SELL signal based on trendline break
VaviStar is an indicator based on trend retracements determined by ZigZag segments. It is theorized, and statistics confirm, that stocks react to certain retracement levels. Many use Fibonacci retracement levels (23.6%, 38.2%, 61.8%). It is assumed that once the price goes beyond the 61.8% retracement, we can already speak of a trend reversal. This indicator allows you to comfortably chart a segment of the ZigZag with the relative operating levels chosen. With a reversal mindset , you can use it
Channel FTF
Pavel Verveyko
The Envelopes indicator determines the presence of a trend or flat. It has 3 types of signals, shows the probable retracement levels and levels of the possible targets. The Fibonacci coefficients are used in the indicator's calculations. Signals (generated when touching the lines or rebounding from lines): Trend - the middle line of the Envelopes has a distinct inclination; the lines below the channel's middle line are used for buy trades, the lines above the middle line and the middle line itse
FiboZag
Andriy Sydoruk
Indicator FiboZag - transfer the indicator to the chart and the Fibonacci levels will be built automatically on the last ZigZag turn. The main advantage lies in the correct construction of Fibonacci levels and markup of price levels. Simple, visual and effective use. The indicator is not redrawn and does not lag. Works on all currency pairs and on all timeframes.
No idea why demo is not working. you can check the GIF to see how it works. Features With this scanner you can detect Candles which are below/above yesterday high/low lines. A pair's rectangle turns RED in dashboard if it is above the yesterday high, and rectangle turns GREEN in dashboard if it is below the yesterday low. It gives alerts in every 15m candle close. Contains a Dashboard which will help you to see all market pair's. It is possible to disable this sorting through to make it easier
This indicator uses the Fibonacci p-numbers to smooth a price series. This allows combining the advantages of the simple and exponential moving averages. The smoothing coefficients depend on the level of the p-number, which is set in the indicator parameters. The higher the level, the greater the influence of the simple moving average and the less significant the exponential moving average. Parameters Fibonacci Numbers Order - order of the Fibonacci p-number, specified by trader. Valid values a
Индикатор канала с адаптивной шириной, который помогает видеть перекупленность/перепроданность , пробои границ и даёт стрелочные сигналы Buy/Sell с аккуратными оповещениями без спама . Индикатор подходит для: скальпинга и внутридневной торговли; поиска точек отката от границ канала; торговли пробоев (breakout) и возвратов (re-entry); ручной торговли и полуавтоматизации через алерты. Как работает индикатор Сглаживание (Nadaraya-Watson) Строится “умная” сглаженная линия цены (ядровая регрессия с
In the context of trading,   Malaysia SNR   (Support and Resistance) refers to the technical analysis of   support and resistance levels   in financial markets, particularly for stocks, indices, or other assets traded. There are three type of Malaysia SNR level Classic , GAP and Flipped 1. Classic Support   is the price level at which an asset tends to stop falling and may start to rebound. It acts as a "floor" where demand is strong enough to prevent the price from dropping further. Resistance
Parabolic SAR Parabolic SAR Technical Indicator was developed for analyzing the trending markets. The indicator is constructed on the price chart. This indicator is similar to the   Moving Average Technical Indicator   with the only difference that Parabolic SAR moves with higher acceleration and may change its position in terms of the price. The indicator is below the prices on the bull market (Up Trend), when it’s bearish (Down Trend), it is above the prices. If the price crosses Parabolic SAR
ZigZag on average
Valeriy Medvedev
This is a well-known ZigZag indicator. But it differs by the fact that its plot is based on values of the middle line which is set by a user. It can display Andrews’ Pitchfork and standard or Bobokus Fibo levels. NO REPAINTING. Parameters Period МА — middle line period. Default value is 34. Minimum value is 4. Maximum value is set at your discretion. Used to calculate price - base price to calculate the middle line. The averaging method - method of smoothing the middle line. Turning pitchfork —
Fibonacci Trend Marker
Grigoriy Malychenko
Fibonacci Trend Marker   — is a trend indicator that analyzes the behavior of the current candle relative to the High-Low (HL) range of previous candles using Fibonacci retracement levels. It visually tracks trend strength, signaling potential weakening or reversal through a change in candle color. Features: Designed for trend-focused traders, it helps quickly identify trend changes based on Fibonacci levels. Effective on any timeframe with sufficient market volatility, when a sequence of 3–5 c
-   Real price is 90$   - 50% Discount ( It is 45$ now ) Contact me for instruction, any questions! Introduction V Bottoms and Tops (or Fibonacci Retracement) are popular   chart patterns   among traders due to their potential for identifying trend reversals. These patterns are characterized by sharp and sudden price movements, creating a V-shaped or inverted V-shaped formation on the   chart . By recognizing these patterns, traders can anticipate potential shifts in market direction and posi
The trader uses the Trend for Neuro indicator to determine the market situation. This is a trending algorithm that is convenient to download, install and use. The algorithm with acceptable accuracy generates input signals and output levels. Strategy for trend trading, filtering and all the necessary functions built into one tool! By launching the indicator, the user will see only two types of arrows that can change color to blue during an uptrend, to red during a downtrend there is no uncertaint
ZoneBlockX — Smart Order Block Detector for MetaTrader 4 ZoneBlockX is a professional-grade supply and demand zone indicator for MetaTrader 4, built on the concept of Order Block detection. It automatically identifies high-probability reversal areas on the chart by locating institutional-style price zones where significant buying or selling activity has previously occurred. Designed for traders who rely on price action and market structure, ZoneBlockX provides a structured and objective view o
"The last MT4 trend indicator you will ever need." SmartTrend Pro   is a professional-grade,   non-repainting   trend indicator for MetaTrader 4, built for traders who demand precision. By combining four proven technical strategies —   EMA Crossover, RSI, Stochastic Oscillator, and ATR Volatility Filter   — it delivers high-probability BUY and SELL signals confirmed only on bar close, eliminating false signals caused by mid-candle fluctuations. Why SmartTrend Pro? Most indicators suffer from one
PRO Fibonacci Tool MT4
Samil Bozuyuk
5 (1)
The indicator is the advanced form of the MetaTrader 4 standard Fibonacci tool. It is unique and very reasonable for serious Fibonacci traders. Key Features Drawing of Fibonacci retracement and expansion levels in a few seconds by using hotkeys. Auto adjusting of retracement levels once the market makes new highs/lows. Ability to edit/remove any retracement & expansion levels on chart. Auto snap to exact high and low of bars while plotting on chart. Getting very clear charts even though many ret
This indicator has a unique support and resistance calculation program, which is a unique trading system. Index characteristics Imagine if you can accurately determine the important trading support and resistance areas and points in advance, how will your trading improve? Based on a unique calculation method, the indicator analyzes the trend, analyzes the current support and resistance, and obtains the current important support resistance and single direction, the calculated stop profit and sto
TrendHackPro V1
Hicham Ait Taleb
TrendHackPro – The Ultimate High/Low Peak Trend Detector Dominate the markets with precision trend detection powered by institutional logic. TrendHackPro   is a professional-grade trading indicator that combines price action, volatility, and momentum into one clean, intuitive visual system. Designed for traders who demand accuracy, clarity, and results — this is not just another moving-average tool. Core Concept TrendHackPro   analyzes market structure through a proprietary blend of ad
이 제품의 구매자들이 또한 구매함
Volatility Trend System - a trading system that gives signals for entries. The volatility system gives linear and point signals in the direction of the trend, as well as signals to exit it, without redrawing and delays. The trend indicator monitors the direction of the medium-term trend, shows the direction and its change. The signal indicator is based on changes in volatility and shows market entries. The indicator is equipped with several types of alerts. Can be applied to various trading ins
Ultimate Sniper Dashboard
Hispraise Chinedum Abraham
4.82 (22)
299달러로 할인! 추후 가격이 인상될 수 있습니다! 아래 설명을 읽어보세요! Ultimate Sniper Dashboard를 위한 최고의 엔트리 시스템: ULTIMATE DYNAMIC LEVELS. (내 제품을 확인하십시오) Ultimate Sniper Dashboard는 MT4 다중 통화 테스트 제한으로 인해 라이브 시장에서만 작동합니다. Ultimate-Sniper 대시보드를 소개합니다! HA-Sniper와 MA-Sniper를 모두 포함하는 최고의 제품입니다. 그리고 많은 특수 모드. Ultimate Sniper Dashboard는 절대 야수입니다! 초보자 또는 전문가 트레이더를 위한 최고의 솔루션! 다시 움직임을 놓치지 마세요! 단순함과 핍을 좋아하는 트레이더를 위해 특별한 제품을 준비했습니다. 본질적으로 단순한 대시보드는 여러 사용자 지정 알고리즘을 기반으로 28개의 통화 쌍을 살펴보는 모든 작업을 수행합니다. 단 하나의 차트로 전문가처럼 시장을 읽을 수 있습니다. 움직이기
Super Signal – Skyblade Edition 전문가용 노리페인트 / 노래그 트렌드 신호 시스템, 뛰어난 승률 제공 | MT4 / MT5용 1분, 5분, 15분과 같은 낮은 타임프레임에서 가장 좋은 성능을 보입니다. 핵심 기능: Super Signal – Skyblade Edition은 추세 매매를 위해 설계된 스마트 신호 시스템입니다. 이 시스템은 다중 필터 로직을 활용하여, 명확한 방향성과 실질적인 모멘텀이 수반된 고품질 추세만을 감지합니다. 이 시스템은 고점 또는 저점을 예측하지 않으며 , 다음 세 가지 조건이 모두 충족될 때만 신호를 발생시킵니다: 명확한 추세 방향 강화되는 모멘텀 건전한 변동성 구조 또한, 시장 세션 기반의 유동성 분석을 통해 신호의 신뢰성과 타이밍을 더욱 향상시킵니다. 신호 특성: 모든 화살표 신호는 100% 리페인트 없음 / 지연 없음 신호가 한 번 발생하면 고정되며, 깜빡이거나 사라지지 않음 차트 상의 시각적 화살표, 정보 패널, 팝업 알
Dynamic Scalper System
Vitalyi Belyh
5 (1)
" Dynamic Scalper System " 지표는 추세 파동 내에서 스캘핑 방식으로 거래하도록 설계되었습니다. 주요 통화쌍 및 금에서 테스트되었으며, 다른 거래 상품과의 호환성이 가능합니다. 추가적인 가격 변동 지원을 통해 추세에 따라 단기 포지션 진입 신호를 제공합니다. 지표의 원리 큰 화살표는 추세 방향을 결정합니다. 작은 화살표 형태의 스캘핑 신호를 생성하는 알고리즘은 추세 파동 내에서 작동합니다. 빨간색 화살표는 상승 방향을, 파란색 화살표는 하락 방향을 나타냅니다. 민감한 가격 변동선은 추세 방향으로 그려지며, 작은 화살표의 신호와 함께 작용합니다. 신호는 다음과 같이 작동합니다. 적절한 시점에 선이 나타나면 진입 신호가 형성되고, 선이 있는 동안 미결제 포지션을 유지하며, 완료되면 거래를 종료합니다. 권장되는 작업 시간대는 M1~H4입니다. 화살표는 현재 캔들에 형성되며, 다음 캔들이 이미 시작되었더라도 이전 캔들의 화살표는 다시 그려지지 않습니다. 입력 매개
BTMM State Engine Pro MT4
Garry James Goodchild
BTMM State Engine Pro is a MetaTrader 4 indicator for traders who use the Beat The Market Maker approach: Asian session context, kill zone timing, level progression, peak formation detection, and a multi-pair scanner from a single chart. It combines cycle state logic with a built-in scanner dashboard so you do not need the same tool on many charts at once. What it does Draws the Asian session range; session times can follow broker server offset or be set in inputs. Tracks level progression (L
GOLD Impulse with Alert
Bernhard Schweigert
4.67 (12)
이 지표는 Advanced Currency IMPULSE with ALERT  +   Currency Strength Exotics  의 2가지 제품의 슈퍼 조합입니다. 그것은 모든 시간 프레임에 대해 작동하며 8개의 주요 통화와 하나의 기호에 대한 강약의 충동을 그래픽으로 보여줍니다! 이 표시기는 금, 이국적인 쌍, 상품, 지수 또는 선물과 같은 기호에 대한 통화 강도 가속을 표시하는 데 특화되어 있습니다. 금, 은, 오일, DAX, US30, MXN, TRY, CNH 등의 진정한 통화 강도 가속(충동 또는 속도)을 표시하기 위해 9번째 줄에 모든 기호를 추가할 수 있습니다. 새로운 기본 알고리즘을 기반으로 구축되어 잠재적인 거래를 훨씬 더 쉽게 식별하고 확인할 수 있습니다. 이는 통화의 강세 또는 약세가 가속되는지 여부를 그래픽으로 표시하고 가속 속도를 측정하기 때문입니다. 자동차의 속도계처럼 생각하면 됩니다. 가속화할 때 Forex 시장에서 동일한 일이 분명히 더 빠르
Route Lines Prices - 은 가격 방향을 찾는 데 사용되는 지표입니다. 간단한 인터페이스에는 가격 움직임 및 미래 방향 계산을 위한 다양한 알고리즘이 포함되어 있습니다. 이러한 알고리즘에는 사용된 시간대에 따른 변동성 계산 및 가격 평활화 기능이 있습니다. 이 지표는 " Calculating price values " 값을 변경하는 단일 매개변수를 제공합니다. 기본값인 1은 균형 잡힌 자동 계산을 제공하며, 별도의 설정 없이 바로 사용할 수 있습니다. 2에서 500 사이의 값을 수동으로 변경하여 자신만의 거래 시스템에 맞게 지표를 맞춤 설정할 수 있습니다. 이 지표는 M1부터 H4까지의 시간대에서 사용을 권장합니다. 모든 거래 상품에 적용 가능합니다. 신호 화살표는 캔들 종가에 생성되며, 과거 차트에는 다시 그려지지 않습니다. 메인 차트에 동일한 화살표가 표시됩니다. 다양한 유형의 알림을 사용할 수 있으며, 내장된 라인 궤적 카운터는 종가를 기반으로 작동합니다. 이는
현재 40% 할인 ! 초보자 또는 전문가 트레이더를 위한 최고의 솔루션! 이 대시보드 소프트웨어는 28개의 통화 쌍에서 작동합니다. 2가지 주요 지표(Advanced Currency Strength 28 및 Advanced Currency Impulse)를 기반으로 합니다. 전체 Forex 시장에 대한 훌륭한 개요를 제공합니다. 고급 통화 강도 값, 통화 이동 속도 및 모든(9) 시간대의 28 Forex 쌍에 대한 신호를 보여줍니다. 추세 및/또는 스캘핑 기회를 정확히 파악하기 위해 차트의 단일 지표를 사용하여 전체 시장을 볼 수 있을 때 거래가 어떻게 개선될지 상상해 보십시오! 잠재적인 거래를 식별하고 확인하면서 강력한 통화와 약한 통화를 더욱 쉽게 식별할 수 있도록 이 지표에 기능을 내장했습니다. 이 표시기는 통화의 강세 또는 약세가 증가 또는 감소하는지 여부와 모든 시간대에서 수행되는 방식을 그래픽으로 보여줍니다. 추가된 새로운 기능은 현재 시장 조건 변화에 적응하는
Dynamic Forex28 Navigator
Bernhard Schweigert
4.43 (7)
Dynamic Forex28 Navigator - 차세대 외환 거래 도구. 현재 49% 할인. Dynamic Forex28 Navigator는 오랫동안 인기 있는 지표의 진화형으로, 세 가지의 힘을 하나로 결합했습니다. 고급 통화 Strength28 지표(695개 리뷰) + 고급 통화 IMPULSE with ALERT(520개 리뷰) + CS28 콤보 신호(보너스). 지표에 대한 자세한 정보 https://www.mql5.com/en/blogs/post/758844 차세대 Strength 지표는 무엇을 제공합니까?  원래 지표에서 좋아했던 모든 것이 새로운 기능과 더 높은 정확도로 강화되었습니다. 주요 기능: 독점적인 통화 Strength 공식.  모든 시간대에 걸쳐 부드럽고 정확한 강도선. 추세와 정확한 진입을 식별하는 데 이상적입니다. 역동적인 시장 피보나치 수준(시장 피보나치).  이 지표에만 있는 고유한 기능. 가격 차트가 아닌 통화 강도에 피보나치가 적용됩니다.
Miraculous Indicator – Gann Square of Nine 기반 100% 비리페인트 Forex 및 바이너리 도구 이 영상은 Miraculous Indicator 를 소개합니다. 이 지표는 Forex 및 바이너리 옵션 트레이더를 위해 특별히 개발된 매우 정확하고 강력한 트레이딩 도구입니다. 이 지표가 독특한 이유는 전설적인 **Gann Square of Nine(Gann 9의 사각형)**과 **Gann's Law of Vibration(Gann 진동의 법칙)**에 기반을 두고 있기 때문입니다. 이는 현대 트레이딩에서 가장 정밀한 예측 도구 중 하나로 손꼽힙니다. Miraculous Indicator는 완전히 비리페인트(non-repaint) 됩니다. 즉, 캔들이 마감된 후에도 신호가 변경되거나 사라지지 않습니다. 보이는 것이 곧 결과입니다. 이는 트레이더가 자신감을 가지고 거래에 진입하고 청산할 수 있는 신뢰할 수 있고 일관된 기반을 제공합니다. 주요 특징: Gann
Linear Trend Predictor - 진입 지점과 방향성 지원선을 결합한 추세 지표입니다. 고가/저가 채널을 돌파하는 원칙에 따라 작동합니다. 지표 알고리즘은 시장 노이즈를 걸러내고 변동성과 시장 역학을 고려합니다. 표시기 기능  평활화 방법을 사용하여 시장 추세와 BUY 또는 SELL 주문을 시작하기 위한 진입 시점을 보여줍니다.  모든 기간의 차트를 분석하여 단기 및 장기 시장 움직임을 파악하는 데 적합합니다.  어떠한 시장과 시간대에도 적용할 수 있으며, 입력 매개변수를 통해 거래자는 자신에게 맞게 지표를 독립적으로 사용자 지정할 수 있습니다.  설정된 지표 신호는 사라지거나 다시 그려지지 않습니다. 이는 캔들 마감 시 결정됩니다.  여러 유형의 알림이 화살표와 결합되어 있습니다.  이 지표는 독립적인 거래 시스템으로 사용할 수도 있고, 다른 거래 시스템에 추가하는 용도로도 사용할 수 있습니다.  모든 수준의 경험을 가진 거래자가 사용할 수 있습니다. 주요 매
Smart Price Action Concepts
Issam Kassas
4.75 (12)
우선적으로, 이 거래 도구는 전문적인 거래에 이상적인 비-다시 그리기 및 지연되지 않는 지표입니다.  온라인 강좌, 사용자 매뉴얼 및 데모. 스마트 가격 액션 컨셉트 인디케이터는 신규 및 경험 많은 트레이더 모두에게 매우 강력한 도구입니다. Inner Circle Trader Analysis 및 Smart Money Concepts Trading Strategies와 같은 고급 거래 아이디어를 결합하여 20가지 이상의 유용한 지표를 하나로 결합합니다. 이 인디케이터는 스마트 머니 컨셉트에 중점을 두어 대형 기관의 거래 방식을 제공하고 이동을 예측하는 데 도움을 줍니다.  특히 유동성 분석에 뛰어나 기관이 어떻게 거래하는지 이해하는 데 도움을 줍니다. 시장 트렌드를 예측하고 가격 변동을 신중하게 분석하는 데 탁월합니다. 귀하의 거래를 기관 전략에 맞추어 시장의 동향에 대해 더 정확한 예측을 할 수 있습니다. 이 인디케이터는 시장 구조를 분석하고 중요한 주문 블록을 식별하고 다양한
Cyclic Impulse
Vitalyi Belyh
차트를 구조화하고 주기적인 가격 변동을 식별하는 기술 지표입니다. 모든 차트에서 작업할 수 있습니다. 다양한 유형의 알림. 그래프 자체에도 추가 화살표가 있습니다. 역사를 재구성하지 않고, 촛불을 닫는 작업에 임한다. M5 이상에서 권장되는 TF입니다. 사용 및 구성이 쉬운 매개변수입니다. 매개변수가 다른 2개의 지표를 사용하는 경우, 다른 지표 없이 해당 지표만 사용할 수 있습니다. 2개의 입력 매개변수가 있습니다 주기성과 신호 지속 시간 이 2개의 매개변수는 차트 구조의 처리와 관련이 있습니다. Cyclicity - 역전 주기가 얼마나 자주 바뀌는지 조절하고 주기를 매끄럽게 합니다. Signal duration - 최소 숫자에서는 가격 움직임의 충격을 감지하고, 최대 숫자에서는 장기적 추세 움직임을 감지합니다.. --------------------------------
Crosskalp1
Mikhail Bilan
Добрый День уважаемые трейдеры!  Вашему вниманию индикатор созданный и работающий на базе трендовика ADX,  для торговли на смене направления движения который учитывает коррекцию и даёт возможность на ней заработать.  Применяю этот индикатор для скальпинга. Рекомендую таймфреймы от 15 ти минутного(М15) до часового (Н1) периодов.  Красный кружок сигнал на продажу- Sell) Зелёный кружок  сигнал на покупку Buy) Чем меньше ваш таймфрейм тем меньше пунктов вы зарабатываете.   Важно выставлять стопы! !В
NAM Order Blocks
NAM TECH GROUP, CORP.
3.67 (3)
MT4 Multi-timeframe Order Blocks detection indicator. Features - Fully customizable on chart control panel, provides complete interaction. - Hide and show control panel wherever you want. - Detect OBs on multiple timeframes. - Select OBs quantity to display. - Different OBs user interface. - Different filters on OBs. - OB proximity alert. - ADR High and Low lines. - Notification service (Screen alerts | Push notifications). Summary Order block is a market behavior that indicates order collection
Quantum Breakout Indicator PRO
Bogdan Ion Puscasu
4.96 (26)
소개       Quantum Breakout PRO   , 브레이크아웃 존 거래 방식을 변화시키는 획기적인 MQL5 지표! 13년 이상의 거래 경험을 가진 숙련된 트레이더 팀이 개발한   Quantum Breakout PRO는   혁신적이고 역동적인 브레이크아웃 영역 전략으로 거래 여정을 새로운 차원으로 끌어올리도록 설계되었습니다. Quantum Breakout Indicator는 5개의 이익 목표 영역이 있는 브레이크아웃 영역의 신호 화살표와 브레이크아웃 상자를 기반으로 한 손절 제안을 제공합니다. 초보자 거래자와 전문 거래자 모두에게 적합합니다. Quantum EA 채널:       여기를 클릭하세요 MT5 버전 :   여기를 클릭하세요 중요한! 구매 후 설치 매뉴얼을 받으려면 개인 메시지를 보내주십시오. 추천: 기간: M15 통화쌍: GBPJPY, EURJPY, USDJPY,NZDUSD, XAUUSD 계정 유형: 스프레드가 매우 낮은 ECN, Raw 또는 Razo
The Super Arrow Indicator provides non-repainting buy and sell signals with exceptional accuracy. Key Features No repainting – confirmed signals remain fixed Clear visual arrows: green for buy, red for sell Real-time alerts via pop-up, sound, and optional email Clean chart view with no unnecessary clutter Works on all markets: Forex, gold, oil, indices, crypto Adjustable Parameters TimeFrame Default: "current time frame" Function: Sets the time frame for indicator calculation Options: Can be set
Precautions for subscribing to indicator This indicator only supports the computer version of MT4 Does not support MT5, mobile phones, tablets The indicator only shows the day's entry arrow The previous history arrow will not be displayed (Live broadcast is for demonstration) The indicator is a trading aid Is not a EA automatic trading No copy trading function The indicator only indicates the entry position No exit (target profit)  The entry stop loss point is set at 30-50 PIPS Or the front hi
MTF Supply Demand Zones
Georgios Kalomoiropoulos
4.82 (22)
자동화된 수요 및 공급 구역의 차세대. 모든 차트에서 작동하는 새롭고 혁신적인 알고리즘. 모든 구역은 시장의 가격 움직임에 따라 동적으로 생성됩니다. 두 가지 유형의 경고 --> 1)가격이 영역에 도달할 때 2)새로운 영역이 형성될 때 당신은 더 이상 쓸모없는 지표를 얻을 수 없습니다. 입증된 결과로 완벽한 거래 전략을 얻을 수 있습니다.     새로운 기능:     가격이 공급/수요 영역에 도달하면 경고     새로운 공급/수요 구역이 생성되면 알림     푸시 알림 알림     핍의 영역 너비 레이블     기동특무부대에 한 번 더 시간이 주어집니다. 따라서 현재보다 위의 2개의 시간 프레임 대신 현재보다 높은 3개의 시간 프레임을 볼 수 있습니다.     Alerts/Zones/MTF 기능을 활성화/비활성화하는 버튼 당신이 얻는 이점:     거래에서 감정을 제거하십시오.     거래 항목을 객관화하십시오.     높은 확률 설정을 사용하여 수익
Meravith
Ivan Stefanov
5 (3)
마켓 메이커를 위한 도구. Meravith는 다음과 같은 기능을 제공합니다: 모든 타임프레임을 분석하고 현재 유효한 추세를 표시합니다. 강세와 약세 거래량이 동일한 유동성 구간(거래량 균형 구간)을 강조 표시합니다. 서로 다른 타임프레임의 모든 유동성 레벨을 차트에 직접 표시합니다. 텍스트 기반 시장 분석을 생성하여 참고용으로 제공합니다. 현재 추세를 기반으로 목표가, 지지선 및 손절가를 계산합니다. 거래의 위험 대비 보상 비율(Risk/Reward)을 계산합니다. 계좌 잔고에 따라 포지션 크기를 산출하고 잠재 수익을 추정합니다. 시장에 중대한 변화가 발생할 경우 경고도 제공합니다. 지표의 주요 라인: 강세/약세 거래량 소진 라인 — 목표가로 사용됩니다. 시장 추세를 나타내는 라인. 시장이 강세인지 약세인지에 따라 색상이 변경되며 추세 지지선 역할을 합니다. 색상은 주로 시장 심리를 보여줍니다. 거래량 균형선(Eq). Eq(Volume Equilibrium) 라인은 시스템의 핵심입니
Introducing the Delta Volume Profile Indicator - Unleash the Power of Institutional Precision!  Technical Indicator: Are you ready to trade like the pros? The Delta Volume Profile Indicator is no ordinary tool. It’s a high-precision, cutting-edge indicator that puts the power of institutional-grade trading in your hands. This unique indicator analyses delta volume distribution in real-time, revealing the market's hidden buy/sell imbalances that the biggest financial institutions rely on to antic
CyberZingFx Volume Plus
Afsal Meerankutty
4.94 (17)
Advanced version of CyberZingFx Volume Plus, the ultimate MT4 indicator for traders seeking highly accurate buy and sell signals. With an additional strategy and price action dot signals that enhances its effectiveness, this indicator offers a superior trading experience for professionals and beginners alike. The CyberZingFx Volume Plus Advanced version combines the power of volume analysis and historical price data with an additional strategy, resulting in even more precise and reliable signals
GoldRush Trend Arrow Signal
Kirk Lee Holloway
5 (2)
GoldRush 트렌드 화살표 신호 GoldRush 트렌드 화살표 신호 지표는 XAU/USD 시장에서 고속 단기 스캘핑 트레이더를 위해 설계된 정밀한 실시간 트렌드 분석을 제공합니다. 1분 시간대에 특화되어 설계된 이 도구는 명확한 진입점을 표시하는 방향성 화살표를 제공하여 스캘퍼들이 변동성이 높은 시장 환경에서도 자신 있게 거래할 수 있도록 합니다. 이 지표는 PRIMARY 및 SECONDARY 경고 화살표로 구성됩니다. PRIMARY 신호는 추세 방향의 변화를 나타내는 흰색과 검은색 방향성 화살표이며, SECONDARY 신호는 PRIMARY 화살표가 지시하는 방향을 확인하고 잠재적인 거래 진입점을 표시하는 파란색과 빨간색 화살표입니다. 참고: 추세 방향이 변경된 후 PRIMARY 경고 화살표가 단 하나만 표시될 경우, 다수의 SECONDARY 파란색/빨간색 화살표가 표시될 수 있음을 유의해야 합니다. SECONDARY 신호는 신호 기준을 충족하는 어떤 캔들 이후에도 표시
Pulse Scalping Line - an indicator for identifying potential pivot points. Based on this indicator, you can build an effective Martingale system. According to our statistics, the indicator gives a maximum of 4 erroneous pivot points in a series. On average, these are 2 pivot points. That is, the indicator shows a reversal, it is erroneous. This means that the second signal of the indicator will be highly accurate. Based on this information, you can build a trading system based on the Martingale
Quantum Trend Sniper MT4
Ian Andrew Nicholson
5 (1)
Quantum Trend Sniper PRO for MetaTrader 4 Quantum Trend Sniper PRO is a professional-grade MT4 indicator built for traders who want selective entries, clear trade structure, and live on-chart decision support . This is not a basic buy/sell arrow tool. It is a complete trading workflow that helps you identify higher-quality setups, project the full trade structure, monitor progression through multiple profit targets, and review trade behavior directly on the chart. Designed for traders who value
El indicador "MR BEAST ALERTAS DE LIQUIDEZ" es una herramienta avanzada diseñada para proporcionar señales y alertas sobre la liquidez del mercado basándose en una serie de indicadores técnicos y análisis de tendencias. Ideal para traders que buscan oportunidades de trading en función de la dinámica de precios y los niveles de volatilidad, este indicador ofrece una visualización clara y detallada en la ventana del gráfico de MetaTrader. Características Principales: Canal ATR Adaptativo: Calcula
Adaptive Volatility Range
Stanislav Konin
5 (4)
Adaptive Volatility Range [AVR] is a powerful tool for identifying key trend reversal points. AVR accurately reflects the Average True Range (ATR) of volatility, taking into account the Volume-Weighted Average Price (VWAP). The indicator adapts to any market volatility by calculating the average volatility over a specific period, ensuring a stable rate of profitable trades. You receive not just an indicator but a professional automated trading system , AVR-EA . Advantages: 100% No Repaint –
Binary Volume Edge – Martingale Stats  Binary options indicator with live pre-signals and full martingale stats Binary Volume Edge – Martingale Stats is a professional tool that combines powerful signal filtering, smart martingale analysis and a unique early alert system. ** Binary Volume Edge – Martingale Stats indicator analysis The indicator is designed for trading binary options on the MetaTrader 4 platform. Its logic is based on a combination of volume analysis, bull/bear strength ind
Market Maker Reversal Scanner
Siyasanga Stephen Mabokela
================================================================ PRODUCT TITLE ================================================================ Market Maker Reversal Scanner Pro — Institutional Reversal & Momentum Scanner for MT4 ================================================================ Real-time multi-symbol scanner that detects high-probability reversal and momentum setups by combining monthly/weekly extreme location with three-day pattern confirmation. Visual quality meter. Sound alert
F-16 비행기 지표를 소개합니다. 이것은 귀하의 거래 경험을 혁신하도록 설계된 최첨단 MT4 도구입니다. F-16 전투기의 비할 데 없는 속도와 정밀성에 영감을 받아이 지표는 고급 알고리즘과 최첨단 기술을 결합하여 금융 시장에서 압도적인 성능을 제공합니다. F-16 비행기 지표를 사용하면 실시간 분석을 제공하고 매우 정확한 거래 신호를 생성하여 경쟁을 앞서갈 수 있습니다. 다양한 자산 클래스에서 수익 기회를 식별하는 데 필요한 동적 기능을 갖추고 있어 확신을 가지고 정보에 근거한 결정을 내릴 수 있습니다. 사용자 친화적인 인터페이스로 구성된 F-16 비행기 지표는 인기있는 MetaTrader 4 플랫폼과 완벽하게 통합되어 원활하고 효율적인 거래 과정을 보장합니다. 초보자 트레이더든 경험 많은 전문가든 이 지표를 쉽게 사용자 정의하여 고유한 거래 스타일과 선호도에 맞출 수 있습니다. F-16 비행기 지표의 강력함을 경험해 보세요. 이 지표는 시장 트렌드를 정확하고 민첩하게 탐색하며
제작자의 제품 더 보기
Crosskalp1
Mikhail Bilan
Добрый День уважаемые трейдеры!  Вашему вниманию индикатор созданный и работающий на базе трендовика ADX,  для торговли на смене направления движения который учитывает коррекцию и даёт возможность на ней заработать.  Применяю этот индикатор для скальпинга. Рекомендую таймфреймы от 15 ти минутного(М15) до часового (Н1) периодов.  Красный кружок сигнал на продажу- Sell) Зелёный кружок  сигнал на покупку Buy) Чем меньше ваш таймфрейм тем меньше пунктов вы зарабатываете.   Важно выставлять стопы! !В
DrakonMA
Mikhail Bilan
Moving indicator. It is written so that it doesn't signal when two moving averages cross. Easy to operate.  It performed well on European and Asian currencies. Designed for long-term and medium-term types of trading.  Индикатор мувингов. Написан так что даёт сигнал при пересечении двух скользящих. Прост в управлении.   Хорошо себя показал на европейских и азиатских валютах.  Рассчитан  на долгосрочный тип торговли. 
FREE
Trendbin
Mikhail Bilan
Трендовый индикатор предназначенный для поиска так называемого  разворота цены.  Который точно показывает трейдеру момент разворота цены. Данный индикатор лучше всего подходит для выставления стоп ордеров, а также для установления движения тренда или настроения рынка.Лучше всего работает в момент установления на рынке сильных трендовых направлений движения , которые происходят приблизительно 40% времени.   مؤشر الاتجاه المصمم للبحث عن ما يسمى بالنقاط المحورية ، الذي يبين بدقة للتاجر لحظة الانعكا
FREE
Script risk management, which calculates for you the potential profit, possible loss, risk percentage, on the entire account and for each instrument. Shows where stop-losses and take-profits are not set. Each line summarizes the number of open transactions for a specific instrument and calculates the percentage of loss from the total deposit. Beyond the line, the final calculation of the balance is summarized, if all transactions are triggered by stop loss; Potential loss, as the sum of all st
FREE
Proinsta78
Mikhail Bilan
3.5 (4)
점은 강한 움직임 방향을 나타냅니다. 자동으로 작동하지 않으며 수동으로 거래를 열고 닫아야 합니다. 포인트에서 직접 이익을 확인하십시오. 스크린 샷에서 파악할 수 있다고 생각합니다. 150-200핍마다 닫습니다. 지표 구독은 예측으로 별도로 협상할 수 있습니다. 개인 메시지 또는 프로필에 표시된 연락처에 씁니다. 나는 외환 주식으로 만 거래하고 다른 것들도 허용됩니다. 이익이나 손실은 그것을 어떻게 사용하느냐에 달려 있습니다. 일단 임대로 시작하세요. 표시기는 신호만 제공하고 추세의 강도를 보여주기 때문에 테스터에 대한 보고서는 없습니다. 2번째 파란색 원이 출현한 후 노란색 2개 이후에 매수 또는 매도 주문을 열 수 있습니다. 변경되었습니다!!! 2021년 7월 23일 좋은 오후입니다 친구들! 이제 구매자의 요청에 따라 구매 또는 판매 조건이 충족되면 표시기가 경고 및 푸시 알림을 보냅니다. MQL 애플리케이션이 설치되어 있으면 푸시 알림이 전화로 옵니다. 애플리케이션에 M
Easy22
Mikhail Bilan
Данный индикатор Форекс построен на теории оценки силы тренда и расчёта, когда нужно входить в рынок. Как только появляется сигнал захода в рынок над свечёй вырисовуется стрелка которая и показывает дальнейшее направление цены. . Это полноценный индикатор который поможет вам принимать решение о входе в рынок и о позиции которую необходимо занять при открытии ордера. 
SessionsI2
Mikhail Bilan
TRADING INDICATOR SHOWS AS JUDGING FROM the NAME BEGINNING AND the END of the THREE TRADING SESSIONS in the FOREX market : ASIAN(RED),EUROPEAN (GREEN), AMERICAN (PURPLE) COLOR. This indicator applies a color marking on the chart of any currency pair, in the form of squares. Each square corresponds to the duration of the session and its height corresponds to the trading range. 
Good day! To your attention the ForexdivergencePS indicator may not be the newest in the trading strategy The Forex indicator detects and displays descending and ascending divergences on the chart. When a new pattern is formed, a pop-up window is triggered. An arrow is formed on the chart that shows the type of phenomenon and helps to open an order in the optimal direction. Friends of traders rate the effectiveness of the tool as above average. You can change settings, including the sensitiv
스캘핑 인스턴트 인디케이터. 지표의 기저값과 함께 매수 또는 매도 신호가 화살표로 표시됩니다. 화살표와 4개의 시간대를 표시하는 지하 표시기가 예보에서 일치할 때 강한 신호로 간주됩니다. 이 지표에는 Skalping 인스턴트 지표가 제공하는 하나의 결과로 축소된 많은 알고리즘과 작업이 포함되어 있습니다. 즉, 거래자에게 시장의 방향을 알려줍니다. 따라서 그는 제공 1. 스캘핑 신호(그림 1) 그림 1-D1과 같이 D1 차트의 선택된 기간과 지표의 지하 섹션에 매수 신호가 있습니다. 신호는 지체 없이 도착합니다. 이 경우 스캘핑 전략을 사용하여 거래하는 것이 좋습니다. 2. 신호 수정 또는 추세. 그림 2와 같이 지하실에서 그래프의 모든 기간에 대해. 모든 기간은 빨간색 영역 -> 매도 위치에 있습니다. 차트 자체의 기간과 지하 지표가 일치할 때 색상이 변경될 때까지 거래를 보류하십시오. 따라서 지표는 다른 전략에 상당히 적응할 수 있습니다. 주요 통화 쌍에 사용하는 것이
Trend Change
Mikhail Bilan
The Trend Change indicator allows you to use the moving average to indicate to the trader a change in the direction of the trend movement. This is a modified indicator, the advantage of which is the ability to keep up with rapid changes in price dynamics in the presence of excellent SMA smoothing over the period. I recommend the standard indicator settings. Apply on a timeframe not lower than M30 
ProPribl
Mikhail Bilan
Характеристики советника Платформа : MetaTrader 4 Версия : 1.0 Обновлён до : 1.1 Валютные пары : USDCHF и прочие инструменты с умеренной волатильностью Таймфрейм : Н1 Тип робота :  сеточник Время работы : не ограничено Принцип торговли Отличие  в том, что здесь лот при построении сетки ордер в( при желании можно не увеличивать) увеличивается не в геометрической, а в арифметической прогрессии. Это снижает нагрузку на депозит и позволяет переживать сильные тренды. В остальном ProPribl стандартный
DivirgentMAX
Mikhail Bilan
Indicator without redrawing Divergent MAX The DivirgentMAX indicator is a modification based on the MACD. The tool detects divergence based on OsMA and sends signals to buy or sell (buy|sell), taking into account the type of discrepancies detected. Important!!!! In the DivirgentMAX indicator, the optimal entry points are drawn using arrows in the indicator's basement. Divergence is also displayed graphically. In this modification of the MACD, the lag problem characteristic of its predecessor i
ScalpingMBM
Mikhail Bilan
This type of arrow indicator works without redrawing signals. The signal on the indicator is shown as arrows (in the direction of movement). It is very simple and effective to use in the Forex market. Type of trading: "Scalping" It is applicable and performs well in intraday trading, as well as long-term trading.  Сигнал на индикаторе показан в виде стрелок ( по направлению движения). Очень прост и эффективен в применении на рынке Форекс. Вид торговли: " Скальпинг"   Применим и хорошо себя по
IndicatorPivot
Mikhail Bilan
The IndicatorPivot indicator is suitable for using forex trading strategies designed for intraday trading. "IndicatorPivot" displays on the price chart of a currency pair the Pivot level (average price for the current day) and the three closest support and resistance levels, calculated based on Fibonacci levels. The "Indicator Pivot" indicator uses Fibonacci levels to solve the problem of building support and resistance levels in Forex trading. This indicator is very easy to understand and to ap
PatternMMB
Mikhail Bilan
The PatternMMB trading indicator finds the most common candlestick analysis patterns and provides trading recommendations based on them. The PatternMMB trading indicator is designed to search for candlestick patterns on the price chart and issue trading recommendations depending on the nature of the found candlestick pattern. It is also possible to send sound notifications when all or any of the selected patterns appear, with an explanation of the pattern and its interpretation. In addition, th
Muvi2A
Mikhail Bilan
Similarly with sales. Additionally, the indicator contains a buy or sell signal in the form of arrows.  Power type indicator.  Test it in a tester to make sure that it works. It is important to select settings depending on the volatility of the asset. Good for scalping and long-term trading. Lots of settings. The most interesting thing is the ability to set in the indicator for moving on timeframes from 1 minute on the timeframes of the main chart. The signals become even more accurate) It
Multi Information Panel
Mikhail Bilan
5 (1)
Multi Information Panel designed to give alot more precision to both trade entries and exits and provide an instant snapshot of a currency pair’s movement. Multi Information Panel works on any currency or timeframe (or it should) and displays the following in the bottom right corner of the chart.. A graph of Stochastic Oscillators on timeframes M1 up to D1. An indication of the market trend using EMA’s on timeframes M1 to D1. The direction of the MACD on the current chart, and crossing of the
Volume solution
Mikhail Bilan
5 (1)
Volume, momentum, and market strength are key indications that price is about to move in a certain direction. The Volume-solution indicator is one indicator which can help traders objectively classify a momentum type of trade setup as one having volume and strength or not. What is the Volume-solution Indicator? The Trading Volume indicator is a custom technical indicator which works somewhat like a market sentiment indicator. It indicates the strength of the bulls and the bears of the market. Wh
ProInsta78AUTO   좋은 오후입니다 상인! 조언자 ProInsta78AUTO에 대해 조금. EA는 다양한 기간, 다양한 거래 수단에 대한 많은 테스트를 통과했습니다. 그리고 성공적인 거래를 위한 자신감 있고 지속적인 지표를 보여주었습니다. 이 Expert Advisor는 자체 지표 Proinsta 78을 기반으로 작성되었습니다. 이 작업의 결과는 전략 테스터의 보고서 형식으로 볼 수 있으며 스크린샷은 설명 및 토론 섹션에 배치했습니다. 아래에서 통화 쌍에 대한 최적화 결과가 포함된 짧은 표를 제공합니다. GBP | USD 초기 보증금: 1000 $ 거래 기간 1년! 일부 최적화 결과는 아래 표에 나와 있습니다.   거래 금액   이익   수익성 예상 이익 전체 거래 시간 동안 최대 손실.   Amount of deals   Profit   Profitability Expected profit Maximum drawdown for the entir
ZiqScalping
Mikhail Bilan
Description of ZiqScalping The ZiqScalping indicator is designed to trade both currencies with high volatility and trend-oriented currencies. Recommended time frame for scalping: М5, М15, М30. Recommended timeframe for intraday trading and above: H1, D1. Works on all pairs! Settings : See screenshots. Decision principle! The indicator is based on 2MA, MACDI,OSMA. Arrows with trend directions and 2MA lines are shown graphically. Calculations of volumes by positions are entered into the fo
Индикатор RSI MT5 - это индикатор Metatrader 5, и суть этого технического индикатора заключается в преобразовании накопленных исторических данных на основе индикатора RSI. Сигналы показаны разными цветами свечей. Смотрите настройки, тестируёте. Это очень полезный индикатор и он точно должен быть у вас . The RSI in candlelight MT5 indicator is a Metatrader 5 indicator, and the essence of this technical indicator is to transform the accumulated historical data based on the RSI indicator. Signals a
Trend Corridor
Mikhail Bilan
Описание индикатора будет крайне коротким. Индикатор Коридор тренда показывает трейдерам зону в которой находится валюта и даёт понимание по какому тренду движется рынок. Визуально очень хорошо воспринимается. Уровни взяты и просчитаны не просто. Полезный индикатор для арсенала индикаторов трейдера. The description of the indicator will be extremely short. The Trend Corridor indicator shows traders the zone in which the currency is located and gives an understanding of which trend the market is
This indicator uses a mathematical calculation algorithm . This algorithm calculates the remainder between the updated model and the actual values and produces the possible progress of the graph on the graph. It is not a super prophet in trading, but it is very good for the trader when entering the market and to analyze it before entering. Applicable for all currencies. Данный индикатор использует алгоритм математических вычислений . Данный алгоритм вычисляет остаток между обновленной моделью и
Proinsta78MT5
Mikhail Bilan
About the Proinsta78MT5 Indicator The dots show a strong direction of movement, if there are no dots, then the movement changes or there will be a trading corridor with an exit. The profit depends on the timeframe, the larger it is, the more you can earn on the movement. I close on average after every 150-200 points. I have shown the conditions for the signal in the form of screenshots in the screenshots 1-2photo section. Also in the third photo, the signals are visible and marked on the grap
필터:
리뷰 없음
리뷰 답변