Stochastic RSI Ind

Contact us for any custom order, CodeYourTrade.com.


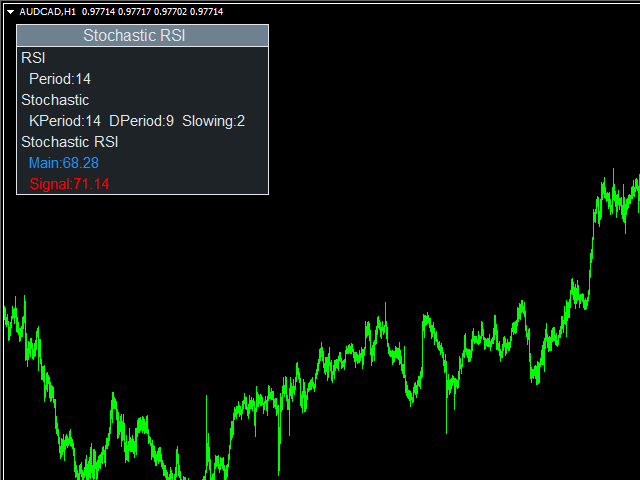
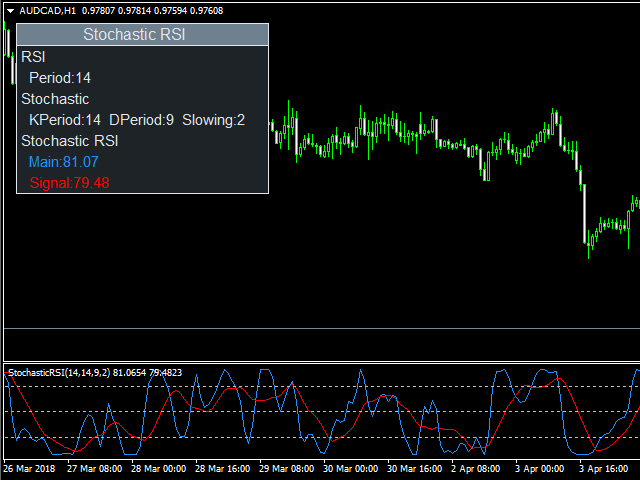
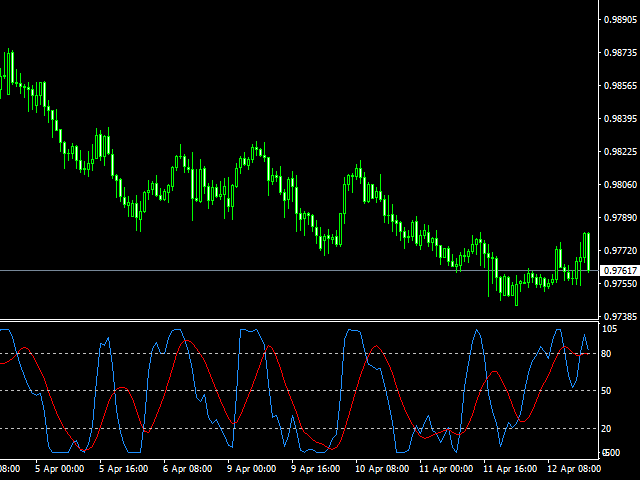
The Stochastic RSI indicator is essentially an indicator of an indicator. It is used in technical analysis to provide a stochastic calculation to the RSI indicator. This means that it is a measure of RSI relative to its own high/low range over a user-defined period of time. This indicator is primarily used for identifying overbought and oversold conditions.

You can hide all the information displayed in the chart by setting false to Show On Chart.
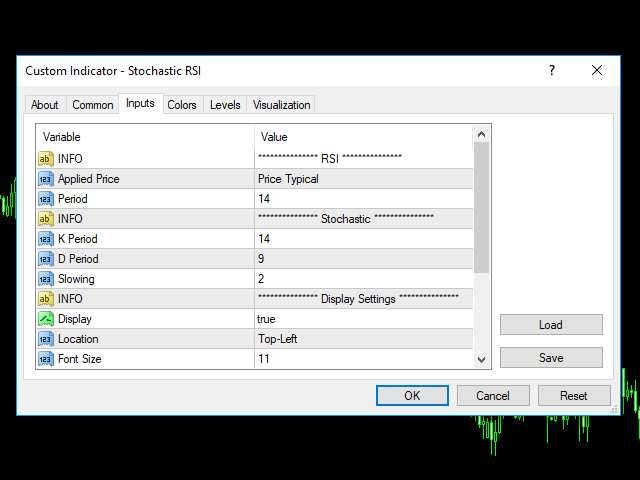
Indicator Setting

RSI

  • Applied Price: Method
    • Close
    • Open
    • High
    • Low
    • Median
    • Typical
    • Weighted
  • Period: Number of period for RSI calculation

Stochastic

  • K Period: Number of time periods for stochastic calculation
  • D Period: Number of time periods used to calculate a moving average of K Period
  • Slowing: Internal smoothing of K Period. A value of 1 is considered a fast stochastic and a value of 3 is considered a slow stochastic
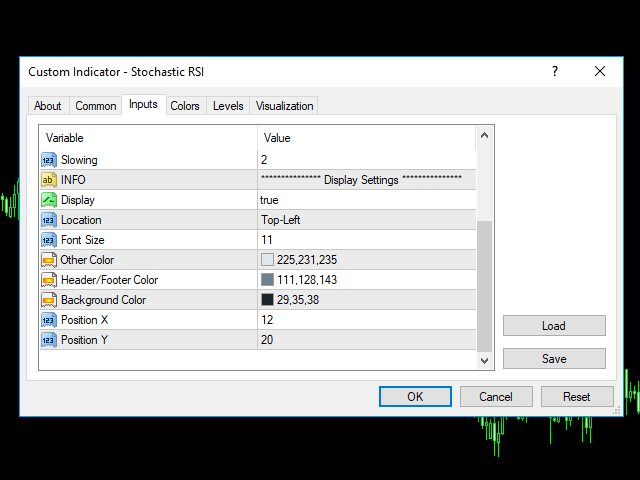
Display Setting

  • Display: Shows the indicator information on chart
  • Location: Location of the display window
    • Top-Left: Display all the details in top-left place
    • Bottom-Left: Display all the details in bottom-left place
  • Font Size: Size of the font
  • Other Color: General Color
  • Header/Footer Color: Header and footer color of display window
  • Background Color: Background color of display window
  • Position X: X-axis position of display window
  • Position Y: Y-axis position of display window

おすすめのプロダクト
VR Cub
Vladimir Pastushak
VR Cub は、質の高いエントリーポイントを獲得するためのインジケーターです。このインジケーターは、数学的計算を容易にし、ポジションへのエントリーポイントの検索を簡素化するために開発されました。このインジケーターが作成されたトレーディング戦略は、長年にわたってその有効性が証明されてきました。取引戦略のシンプルさはその大きな利点であり、初心者のトレーダーでもうまく取引することができます。 VR Cub はポジション開始ポイントとテイクプロフィットとストップロスのターゲットレベルを計算し、効率と使いやすさを大幅に向上させます。取引の簡単なルールを理解するには、以下の戦略を使用した取引のスクリーンショットを見てください。 設定、設定ファイル、デモ版、説明書、問題解決方法は、以下から入手できます。 [ブログ] レビューを読んだり書いたりすることができます。 [リンク] のバージョン [MetaTrader 5] エントリーポイントの計算ルール ポジションをオープンする エントリーポイントを計算するには、VR Cub ツールを最後の高値から最後の安値までストレッチする必要があります。 最初
「Auto FIBO Pro」Crypto_Forex インジケーターは、取引の補助ツールとして最適です。 - インジケーターは、フィボナッチ レベルとローカル トレンド ライン (赤色) を自動的に計算してチャート上に配置します。 - フィボナッチ レベルは、価格が反転する可能性のある重要な領域を示します。 - 最も重要なレベルは、23.6%、38.2%、50%、61.8% です。 - リバーサル スキャルピングやゾーン グリッド取引に使用できます。 - Auto FIBO Pro インジケーターを使用して、現在のシステムを改善する機会も多数あります。 - Info Spread Swap Display があり、接続されている外国為替ペアの現在のスプレッドとスワップを表示します。 - ディスプレイには、アカウントの残高、エクイティ、マージンも表示されます。 - Info Spread Swap Display は、チャートのどのコーナーにも配置できます。 高品質のトレーディングロボットとインジケーターをご覧になるにはここをクリックしてください! これは、この MQL5 ウェブサイ
Advanced Stochastic Scalper - is a professional indicator based on the popular Stochastic Oscillator. Advanced Stochastic Scalper is an oscillator with dynamic overbought and oversold levels, while in the standard Stochastic Oscillator, these levels are static and do not change. This allows Advanced Stochastic Scalper to adapt to the ever-changing market. When a buy or a sell signal appears, an arrow is drawn on the chart and an alert is triggered allowing you to open a position in a timely mann
EARLY REMINDER: The Starting price is 65 price will rise soon up to 365$ and then 750$ after first 10 copies of sales. Grab this offer now! Introduction Hello, traders! Welcome to the demonstration of the Forex Beast Indicator , a comprehensive tool designed to assist aspiring traders in navigating the complexities of the forex market. This indicator incorporates seven essential components to provide a well-rounded trading experience: Moving Averages Colored Zones Support and Resistance Levels
「ダイナミック・スキャルピング・オシレーター」は、MT4向けの高度なカスタムCrypto_Forexインジケーターです。効率的な取引ツールです! - 新世代のオシレーター - 使い方は画像をご覧ください。 - ダイナミック・スキャルピング・オシレーターは、適応型の売られ過ぎ/買われ過ぎゾーンを備えています。 - オシレーターは、動的な売られ過ぎ/買われ過ぎエリアから正確なエントリーポイントを見つけるための補助ツールです。 - 売られ過ぎ値:グリーンラインより下、買われ過ぎ値:オレンジラインより上。 - このインジケーターは、プライスアクションパターンと組み合わせるのに最適です。 - 標準的なオシレーターよりもはるかに正確です。対応時間枠:M30、H1、H4、D1、W1。 - PCとモバイルの両方でアラート機能付き。 高品質のトレーディングロボットとインジケーターをご覧になるにはここをクリックしてください! これは、このMQL5ウェブサイトでのみ提供されるオリジナル製品です。
Magical Arrow
Ranguni Abdulsamir Abdulmajid
Magical Arrow Indicator – Clear & Reliable Signals The Magical Arrow Indicator is a non-repainting, trend-following tool that gives you crystal-clear Buy and Sell signals . It  high-probability reversals and entries . No more guesswork – just follow the arrows on your chart! The Magical Arrow Indicator is a powerful, easy-to-use trading tool that helps you catch the most profitable Buy and Sell opportunities in the Forex market. It is designed for beginners and professional traders , giving y
Super Reversal Pattern Indicator Unlock the power of advanced pattern recognition with our Super Reversal Pattern Indicator. Designed for traders seeking precision and reliability, this indicator identifies one of the most effective reversal patterns in technical analysis, offering a significant edge in your trading strategy. Key Features: Non-Repainting Accuracy: Enjoy the confidence of non-repainting technology. Once a Super Reversal Pattern is detected, it remains static, providing consiste
[ZhiBiCCI]インディケータは全てのサイクル使用に適しており、そして全ての市場品種にも適しています。 [ZhiBiCCI]緑色の実線は強気の発散の逆転です。緑色の点線は古典的な強気の発散です。 [ZhiBiCCI]赤への実線は逆弱気の発散である。赤い点線は古典的な弱気の発散です。 [ZhiBiCCI]はパラメータ(アラート、メール送信、通知送信)で設定でき、(true)に設定するとインスタント信号をアラームウィンドウに送信し、Eメール、インスタントメッセージを送信できます。 パラメータ設定の説明 [displayAlert]:これはアラームスイッチで、trueに設定され、矢印が表示されればプロンプトに自動的に警告され、falseに設定されれば警告されません。 [sendmail_NO_OFF]:これはメールを送信するためのスイッチで、trueに設定します。矢印が表示されていればMT4で設定したメールボックスにメールを送信し、falseに設定されていればメールを送信しません。 [sendnotification_NO_OFF]:これはインスタントメッセージを送信するた
Credible Cross System   indicator is designed for signal trading. This indicator generates trend signals. It uses many algorithms and indicators to generate this signal. It tries to generate a signal from the points with the highest trend potential. The indicator works based on instant price movements. This indicator is a complete trading product. This indicator does not need any additional indicators. The indicator certainly does not repaint. The point at which the signal is given does not c
KT Pin Bar
KEENBASE SOFTWARE SOLUTIONS
KT Pin Bar identifies the pin bar formation which is a type of price action pattern which depicts a sign of reversal or rejection of the trend. When combined with support and resistance, BRN and other significant levels, Pin Bar pattern proved to be a very strong sign of reversal. Basically, a pin bar is characterized by a small body relative to the bar length which is closed either in upper or lower 50% part of its length. They have very large wicks and small candle body. A pin bar candlestic
Quantum Falcon Signal Free is a smart visual trading indicator for MetaTrader 4 designed for Forex and Gold traders. The indicator combines: • Trend analysis • RSI momentum confirmation • MACD momentum filtering • ATR volatility filtering • Higher timeframe confirmation • Smart exit signal detection Main Features: • Smart Buy and Sell signals • Exit Buy / Exit Sell alerts • Real-time dashboard on chart • Professional candle arrows • Multi-timeframe trend confirmation • ATR market volatility filt
FREE
Crypto_Forex MT4 用インジケーター「モーニング スター パターン」 - インジケーター「モーニング スター パターン」は、プライス アクション トレーディングに非常に強力なインジケーターです。再描画なし、遅延なし。 - インジケーターは、チャート上で強気のモーニング スター パターンを検出します。チャート上の青い矢印信号 (画像を参照)。 - PC、モバイル、および電子メール アラート付き。 - また、その兄弟である弱気の「イブニング スター パターン」インジケーターも利用できます (以下のリンクに従ってください)。 - インジケーター「モーニング スター パターン」は、サポート/レジスタンス レベルと組み合わせるのに最適です。 高品質のトレーディングロボットとインジケーターをご覧になるにはここをクリックしてください! これは、この MQL5 Web サイトでのみ提供されるオリジナル製品です。
SMC Venom Model BPR インジケーターは、スマート マネー (SMC) コンセプトで取引するトレーダー向けのプロフェッショナル ツールです。価格チャート上の 2 つの主要なパターンを自動的に識別します。 FVG   (フェアバリューギャップ) は、3 本のローソク足の組み合わせで、最初のローソク足と 3 番目のローソク足の間にギャップがあります。ボリュームサポートのないレベル間のゾーンを形成し、価格修正につながることがよくあります。 BPR   (バランス価格範囲) は、2 つの FVG パターンの組み合わせで、「ブリッジ」を形成します。これは、価格がボリュームアクティビティの少ない動きで動くときに、ブレイクアウトしてレベルに戻るゾーンで、ローソク足の間にギャップを作成します。 これらのパターンは、大規模な市場プレーヤーと一般参加者の相互作用が発生するチャート上のボリュームと価格動向の分析に基づいて、トレーダーが主要なサポート/レジスタンス レベル、ブレイクアウト ゾーン、エントリ ポイントを識別するのに役立ちます。 インジケーターは、長方形と矢印の形でパターンを視
Indicator for binary options arrow is easy to use and does not require configuration works on all currency pairs, cryptocurrencies buy signal blue up arrow sell signal red down arrow tips do not trade during news and 15-30 minutes before their release, as the market is too volatile and there is a lot of noise it is worth entering trades one or two candles from the current period (recommended for 1 candle) timeframe up to m 15 recommended money management fixed lot or fixed percentage of the depo
The indicator shows the potential trend direction by cyclical-wave dependence. Thus, all the rays of the intersection will be optimal rays, in the direction of which the price is expected to move, taking into account the indicator period. Rays can be used as a direction for potential market movement. But we must not forget that the approach must be comprehensive, the indicator signals require additional information to enter the market.
ROYAL DUTCH SKUNK USES THE TREND WAVE INDICATOR AND IT CAN IDENTIFY THE BEGINNING AND THE END OF A NEW WAVE TREND MOVEMENT. AS AN OSCILLATOR, THE INDICATOR IDENTIFIES THE OVERBOUGHT AND OVERSOLD ZONES. IT WORKS GREAT TO CATCH THE SHORT TERM PRICE REVERSALS AND USES A MARTINGALE STRATEGY TO CLOSE ALL TRADES IN PROFIT. USE DEFAULT SETTINGS ON H1 OR HIGHER TIME FRAME ON ANY PAIR FOR MORE ACCURATE TRADES WHY THIS EA : Smart entries calculated by 6 great strategies The EA can be run on even a $20000
回帰取引を意味する専門的かつ定量的なアプローチを実装する独自の指標。これは、価格が予測可能かつ測定可能な方法で迂回して平均に戻るという事実を利用しており、非定量的な取引戦略を大幅に上回る明確な出入りルールを可能にします。 [ Installation Guide | Update Guide | Troubleshooting | FAQ | All Products ] 明確な取引シグナル 驚くほど簡単に取引できます カスタマイズ可能な色とサイズ パフォーマンス統計を実装します ほとんどの取引戦略を上回ります 適切なSLおよびTPレベルを表示します 電子メール/音声/視覚アラートを実装します 使い方 インディケータは、より高い時間枠からの完全にカスタマイズ可能な移動平均の周りの標準偏差を測定し、トレンドフォローアプローチを使用して正確に取引を見つけます。取引は、現在のチャートの価格アクションに飛び込むことによって見つけられ、価格が選択したより高い時間枠から計算された平均価格帯に戻ったときに閉じられます。それがコード化される方法のために、指標は高ボラティリティと強いトレンドの市場か
The Th3Eng PipFinite indicator is based on a very excellent analysis of the right trend direction with perfect custom algorithms. It show the true direction and the best point to start trading. With StopLoss point and Three Take Profit points. Also it show the right pivot of the price and small points to order to replace the dynamic support and resistance channel, Which surrounds the price. And Finally it draws a very helpful Box on the left side on the chart includes (take profits and Stop loss
Trend PRO Expert Advisor  is developed base on the PipFinite Trend PRO Indicator, the best indicators on the market so far. PipFinite  Trend Pro's smart algorithm detects the trend, filters out market noise and gives entry signals with exit levels.  This EA open order when the indicator has buy/sell signals and set SL/TP follow the indicator rules. You can read more information about PipFinite Trend PRO indicator  here . Important Information   This EA will only work if you purchased  PipFinte
Fisher Yur4ik MT4は、テクニカル分析の力を活用して、トレーダーに市場のトレンドに関する正確な洞察を提供する高度なトレーディングインジケーターです。MetaTrader 4専用に設計されたこのインジケーターは、意思決定プロセスを強化し、トレーディング結果を改善したいトレーダーに最適です。 Fisher Yur4ik MT4を利用することで、トレーダーはリアルタイムのアラートと明確な視覚信号を得て、さまざまな金融市場で利益を上げるトレーディング機会を捉えることができます。 MQL製品のインストールガイド | MT4/MT5で購入したMQL製品の更新 | 一般的なトラブルシューティングガイド | インジケーター設定 / ガイド 主な特徴 バッファ統合: インジケーターの値をアクセス可能なバッファとして公開し、Expert Advisorが信号ベースのトレーディング戦略を利用できるようにします。 迅速かつバックテスト可能: MetaTraderのネイティブOnCalculate()エンジンに基づいて構築されており、迅速な計算とストラテジーテスターとの完全な互換性を提供します。
MetaTraderでは、複数の   水平線   を描画し、それぞれの価格レベルを追跡するのは面倒な作業になることがあります。このインジケーターは、価格アラートの設定、サポートとレジスタンスの表示、その他の手動用途のために、等間隔で複数の水平線を自動で描画します。 このインジケーターは、短期間で売買による利益を狙いたい初心者のFXトレーダーに最適です。水平線は、相場がトレンド中またはレンジ相場である場合に、エントリーの可能性があるゾーンを見つける手助けをしてくれます。 機能 入力設定に基づいて、瞬時に複数の水平線を描画可能。 各水平線を区別しやすいように、カラフルなカラーテーマを採用。 複数の取引セッションのレンジを追跡するのに必須のツール。 価格が水平線にタッチした際にアラートを送信。 アラート間に間隔を設定でき、過度な通知を防止。 完全にカスタマイズ可能。 解説 このインジケーターは、入力設定で指定されたデータと指示に従って水平線を描画します。価格がこれらの水平線でどのように反応するかを観察することで、重要なサポート・レジスタンス付近でのトレード機会を見極めることができます。
Perfect for one minutes high trading and scalping. This indicator is very effective for trading on one minutes, in the hour. A combination of moving averages and STOCHASTICS calculation to produce a very convincing signal every hour. Blue colour signals a buy opportunity. Follow the X signs for possible buy points. The Blue average line serves as possible trend direction and support. Red colour signals a sell opportunity. Follow the X signs for possible sell points. The Red average line serves a
FREE
Noize Absorption Index - is the manual trading system that measures the difference of pressure between bears forces and bulls forces. Green line - is a noize free index that showing curent situation. Zero value of index shows totally choppy/flat market.Values above zero level shows how powerfull bullish wave is and values below zero measures bearish forces.Up arrow appears on bearish market when it's ready to reverse, dn arrow appears on weak bullish market, as a result of reverse expectation. S
Binary Options Support Resistance Indicator This indicator is designed for binary options trading and effectively shows retracements from support and resistance levels. Signals appear on the current candle. A red arrow pointing downwards indicates a potential selling opportunity, while a blue arrow pointing upwards suggests buying opportunities. All that needs adjustment is the color of the signal arrows. It is recommended to use it on the M1-M5 timeframes as signals are frequent on these timef
このインジケータは、AB = CDリトレースメントパターンを検出します。 AB = CDリトレースメントパターンは、初期価格セグメントが部分的にリトレースされ、プルバックの完了から等距離の動きが続く4ポイントの価格構造であり、すべての調和パターンの基本的な基盤です。 [ インストールガイド | 更新ガイド | トラブルシューティング | よくある質問 | すべての製品 ] カスタマイズ可能なパターンサイズ カスタマイズ可能なACおよびBD比率 カスタマイズ可能なブレイクアウト期間 カスタマイズ可能な線、色、サイズ CD fiboレベルに基づいてSLおよびTPレベルを表示します パターンとブレイクアウトの視覚/音声/プッシュ/メールアラート AB = CDリトレースメントは、かなり拡大して再描画できます。物事を簡単にするために、このインディケーターはひねりを実装します。トレードをシグナルする前に、正しい方向へのドンチャンブレイクアウトを待ちます。最終結果は、非常に信頼性の高い取引シグナルを備えた再描画インジケーターです。ドンチャンのブレイクアウト期間が入力として入力されます。 強
Heiken Ashi candle chart is an improved version of The Japanese candle chart, which can effectively filter the market "noise" of the Japanese candle chart. It is favored by many traders for its simplicity and intuition. For trend traders, the HA candle chart is a magic tool. Unlike the traditional Japanese candle chart, Heikenashi does not reflect the opening price, high price, low price and closing price of the market. Instead, Heikenashi calculates the value of a single K line in the dominant
Angry bull Option Binary
Fabio Oliveira Magalhaes
1 (1)
Angry Bull Option Binary   This is a Binary Options robot, which contains 7 strategies, you can backtest it to check what the best strategies are Settings Initial Batch Value Dynamic Investment = If activated it will use an automatic lot according to its capital Balance ($) w/ backtest = Starting balance to backtest PorcRiscoInvestment = It will be the value of % for the automatic lot if it is activated Expiration (in minutes) = It will be the expiration time of orders in Binary Options Magic
In the stock market technical analysis, support and resistance is a concept that the movement of the price of a security will tend to stop and reverse at certain predetermined price levels. Support and resistance levels can be identified on any timeframe. However, the most significant ones are found on the higher time frames, such as daily, weekly, and monthly. This indicator using the weekly OHLC data to identify the relevant levels. This is a support and resistance indicator and providing majo
MajorAlert - is a professional trading indicator for MetaTrader 4 that combines two distinct market analysis approaches into one powerful tool. By integrating a counter‑trend entry logic (upper block) with a trend‑following filter (lower block), the indicator generates high‑probability signals on the chart with clearly separated arrow colors. Key Features Fully self‑contained   – no external indicators required; all calculations are built‑in. Versatile inputs   – adjust all parameters to suit a
Introducing the "Magic Trades" for MetaTrader 4 – your ultimate tool for precision trading in dynamic markets. This innovative indicator revolutionizes the way you perceive market trends by harnessing the power of advanced analysis to detect subtle changes in character, paving the way for optimal trading opportunities. The Magic Trades Indicator is designed to empower traders with insightful entry points and well-defined risk management levels. Through its sophisticated algorithm, this indicato
このプロダクトを購入した人は以下も購入しています
Neuro Poseidon is a new indicator by Daria Rezueva. It combines precise trading signals with adaptive TP/SL levels - creating best possible trades as a result! Message me and get  Neuro Poseidon Assistant  as a gift to automize your trading process! What makes it stand out? 1. Proven profitability on all assets and timeframes 2. Only confirmed BUY and SELL signals present on the chart 3. Adaptive TP & SL levels generated by the software for each trade 4. Easy to understand - suitable for all
M1 SNIPER は使いやすいトレーディングインジケーターシステムです。M1時間足向けに設計された矢印インジケーターです。M1時間足でのスキャルピングのためのスタンドアロンシステムとして、また既存のトレーディングシステムの一部としても使用できます。このトレーディングシステムはM1時間足での取引に特化して設計されていますが、他の時間足でも使用できます。元々、この手法はXAUUSDとBTCUSDの取引用に設計しましたが、他の市場においても役立つと考えています。 インジケーターのシグナルは、トレンドの方向と逆方向に取引できます。インジケーターのシグナルを利用して両方向に取引するのに役立つ特別な取引テクニックをご紹介します。この手法は、特別な動的なサポートとレジスタンスの価格帯を利用することに基づいています。 ご購入後、M1 SNIPER矢印インジケーターをすぐにダウンロードできます。さらに、M1 SNIPERツールのすべてのユーザーに、以下のスクリーンショットに表示されているApollo Dynamic SRインジケーターを無料で提供しています。この2つのインジケーターを組み合わせることで
Gann Made Easy は、ミスター・ギャンの理論を使用した取引の最良の原則に基づいた、プロフェッショナルで使いやすい外国為替取引システムです。 W・D・ガン。このインジケーターは、ストップロスとテイクプロフィットレベルを含む正確な買いと売りのシグナルを提供します。 PUSH通知を利用して外出先でも取引可能です。 ご購入後、取引方法の説明と優れた追加インジケーターを無料で入手するには、私にご連絡ください! おそらく、ギャンの取引手法についてはすでに何度も聞いたことがあるでしょう。通常、ギャンの理論は初心者のトレーダーだけでなく、すでにある程度の取引経験がある人にとっても非常に複雑なものです。なぜなら、ギャンの取引手法は理論的にはそれほど簡単に適用できるものではないからです。私はその知識を磨き、最良の原則を私の外国為替インジケーターに組み込むために数年を費やしました。 このインジケーターは非常に簡単に適用できます。必要なのは、それをチャートに添付し、簡単な取引推奨事項に従うだけです。このインジケーターは常に市場分析の仕事を行い、取引の機会を探します。適切なエントリーポイントを検出す
Scalper Inside PRO Scalper Inside PRO は、MetaTrader 4 向けの短期トレンドおよびスキャルピング用インジケーターです。独自アルゴリズムを用いて、市場の方向性と主要なターゲットレベルを素早く検出します。エントリー、イグジット、複数の利確ターゲットを自動計算し、詳細なパフォーマンス統計を表示することで、さまざまな銘柄やストラテジーがどのように機能してきたかを確認できます。これにより、現在のマーケットコンディションに最も適した取引銘柄を選択するのに役立ちます。さらに、Scalper Inside PRO には、お使いの矢印インジケーターを簡単に接続でき、その統計と過去のパフォーマンスを素早く評価できます。 本インジケーターは、あらゆる銘柄と時間足で動作し(短期トレードには M5 を推奨)、複数の内蔵ストラテジーを備えています。そのため、単体のスキャルピングツールとしても、トレーディングシステム内の強力な分析コンポーネントとしても活用できます。 主な機能 独自アルゴリズム(Next‑Generation Trend Detection Algor
PRO Renko Systemは、特別にRENKOチャートを取引するために設計された高精度の取引システムです。 これは、様々な取引商品に適用することができる普遍的なシステムです。 システムは効果的に正確な逆転信号へのアクセスを与えるいわゆる市場の騒音を中和する。 表示器は非常に使いやすく、信号の生成に責任がある1つの変数だけがあります。 あなたは簡単にお好みの任意の取引ツールとレンコバーのサイズにツールを適応させることができます。 私はいつもあなたが私のソフトウェアで収益性の高い取引を支援するために余分なサポートを提供する準備ができています! 私はあなたに幸せで収益性の高い取引をしたいです! ご購入後にご連絡ください! 私はあなたに私のレンコチャートジェネレータを送信します。 私はまた、私の個人的な推奨事項やシステムの他のモジュールを無料で共有します!
Dynamic Forex28 Navigator - 次世代の Forex 取引ツール。 現在 49% オフ。 Dynamic Forex28 Navigator は、長年人気のインジケーターを進化させたもので、3 つの機能を 1 つにまとめています。 Advanced Currency Strength28 インジケーター (レビュー 695 件)  + Advanced Currency IMPULSE with ALERT (レビュー 520 件) + CS28 コンボ シグナル (ボーナス)。 インジケーターの詳細 https://www.mql5.com/en/blogs/post/758844 次世代の Strength インジケーターが提供するもの  オリジナルで気に入っていたすべての機能が、新機能と精度の向上によって強化されました。 主な機能: 独自の通貨強度計算式。 すべての時間枠でスムーズかつ正確な強度ライン。 トレンドの特定と正確なエントリーに最適です。 ダイナミックマーケットフィボナッチレベル (マーケットフィボナッチ)。 このインジケーターに固有
Trend Catcher ind
Ramil Minniakhmetov
5 (1)
トレンドキャッチャーインジケーター トレンドキャッチャーインジケーターは、開発者独自の適応型トレンド分析指標を組み合わせることで、市場価格の動きを分析します。短期的なノイズを除去し、根底にあるモメンタムの強さ、ボラティリティの拡大、価格構造の挙動に焦点を当てることで、真の市場方向性を特定します。また、移動平均線、RSI、ボラティリティフィルターなどの平滑化およびトレンドフィルタリング機能を備えたカスタマイズ指標も使用します。 実際の運用状況のモニタリングやその他の製品については、こちらをご覧ください: https://www.mql5.com/en/users/mechanic/seller ご注意ください。私はTelegramでEAや設定を販売していません。詐欺です。すべての設定はブログで無料で公開しています。 重要!ご購入後すぐにご連絡ください。手順とボーナスをお送りします!
トレンドラインプロ   市場の真の方向転換点を理解するのに役立ちます。この指標は、真のトレンド反転と主要プレーヤーが再び参入するポイントを示します。 分かりますか     BOSライン   複雑な設定や不要なノイズなしに、より長い時間足でのトレンドの変化と重要なレベルを把握できます。シグナルは再描画されず、バーが閉じた後もチャート上に残ります。 VERSION MT 5     -     RFI LEVELS PRO インジケーター と組み合わせることで、その潜在能力を最大限に発揮します。 インジケーターが示す内容: 本当の変化   トレンド(BOSライン) 一度シグナルが現れたら、それは有効です!これは、リペイント機能を持つインジケーターとの重要な違いです。リペイント機能を持つインジケーターは、シグナルを発した後、それを変更し、資金の損失につながる可能性があります。これにより、より高い確率と精度で市場に参入できます。また、矢印が現れた後、目標値(利益確定)に達するか、反転シグナルが現れるまで、ローソク足の色を変更する機能もあります。 繰り返しエントリ       主要プレーヤーの
Enigmera
Ivan Stefanov
5 (8)
ENIGMERA: 市場の中心 重要:MQL5.comのデモはStrategy Testerで実行されており、Enigmeraの機能を完全には反映していない場合があります。詳細については、説明、スクリーンショット、ビデオをご確認ください。質問があれば、遠慮なくメッセージを送ってください! インジケーターのコードは完全に書き直されました。バージョン3.0は新機能を追加し、インジケーターの開始以来蓄積されたバグを修正しました。 紹介 このインジケーターとトレーディングシステムは、金融市場への注目すべきアプローチです。ENIGMERAはフラクタルサイクルを使用して、サポートとレジスタンスのレベルを正確に計算します。真の蓄積フェーズを示し、方向と目標を提供します。トレンドでも修正でも機能するシステムです。 動作方法 インジケーターのほとんどの機能は、チャートの左側にあるボタンで制御され、市場の状況に迅速に対応できるようになっています。 ボタン ON/OFF – インジケーター全体を表示または非表示にします。 Channel – サポートチャネルを有効にし、許容範囲の偏差を示します。 Dev
多くの矢印インジケーターは、シグナルだけを表示して、その後の判断はすべてトレーダー任せです。KT Alpha Hunter Arrows は、最初から完成されたトレードプランを提供します。 各シグナル矢印が表示されると、エントリーライン、ストップロス、4つのテイクプロフィット水準、そして現在の銘柄と時間足を今トレードする価値があるかを示すリアルタイムのエッジ判定が、チャート上にまとめて描画されます。付属の Trade Manager EA は、手動でエントリーした後の管理をサポートし、相場が荒れて感情が揺れやすい場面でも、トレードの規律を保ちやすくします。リペイントなし。確定足のみでシグナルを表示。Forex、ゴールド、指数、その他あなたが取引するあらゆる銘柄向けに設計されています。 主な機能 リペイントしない買い・売り矢印。シグナルは足が確定した後にのみ表示されます。 各シグナルにエントリーライン、構造的なストップロス、4つのテイクプロフィット水準を表示。 Edge Dashboard が、現在のチャート上で買いと売りのセットアップを個別に評価。 判定システム:No Edge、Ma
このインジケーターは実践的なトレードに最適な自動波動分析のインジケーターです! 場合... 注:   Tang Lun (Tang Zhong Shuo Zen) の命名規則の影響で、私は波のグレーディングに西洋の名前を使用することに慣れていません。基本的な波を ペン 、二次波のバンドを セグメント と名付けました。同時に、 セグメント にはトレンドの方向が指定されます (この命名方法は将来のノートで使用されます。最初に言っておきます)。ただし、アルゴリズムは曲がりくねった理論とはほとんど関係がないため、付けるべきではありません。これは、私の市場分析 によって要約された、絶えず変化する複雑な運用ルール を反映しています。 バンドは標準化され、人によって異なることがないよう定義されており、市場参入を厳密に分析する上で重要な役割を果たす人為的な干渉の描画方法が排除されています。 このインジケーターを使用することは、取引インターフェイスの美しさを改善することと同等であり、元の K ライン取引を放棄し、取引の新しいレベルに連れて行きます。また、宣伝の観点から顧客の認識も向上します。 イ
Genesis Matrix Pro is a professional multi-timeframe trend detection indicator designed to help traders identify high-quality market alignment with clarity and structure. It combines 12 different technical indicators into one visual alignment matrix, allowing traders to quickly see when market conditions are bullish, bearish, or neutral. A signal is generated only when the selected strategies are aligned, helping reduce noise and improve decision-making. PLEASE CONTACT ME AFTER PURCHASE TO GET
この製品は 2026 年の市場向けに更新され、最新の MT5 ビルドに最適化されています。 価格更新のお知らせ: Smart Trend Trading System は現在 $99 で提供されています。 次の 30 件の購入 後、価格は $199 に上がります。 特別オファー: Smart Trend Trading System を購入後、私にプライベートメッセージを送ることで、 Smart Universal EA を無料 で受け取り、Smart Trend のシグナルを自動売買に変えることができます。 Smart Trend Trading System は、リペイントなし、再描画なし、遅延なしの完全なトレーディングシステムです。よりクリーンなシグナル、より明確なトレンド方向、そしてより整理された取引方法を求めるトレーダー向けに作られています。 Online course , manual and download presets . このシステムは、トレンド検出、反転ゾーン、Smart Cloud、トレーリングストップロジック、サポートとレジスタンス、ローソク足の色分け、ア
MTF Supply Demand Zones
Georgios Kalomoiropoulos
4.82 (22)
次世代の自動化された需要と供給のゾーン。どのチャートでも機能する新しい革新的なアルゴリズム。すべてのゾーンは、市場の価格行動に従って動的に作成されています。 2種類のアラート --> 1) 価格がゾーンに達したとき 2) 新しいゾーンが形成されたとき もう 1 つの役に立たない指標はありません。実績のある完全な取引戦略を手に入れることができます。     新機能:     価格が需給ゾーンに達したときにアラートを出す     新しい需給ゾーンが作成されたときにアラートを発します     プッシュ通知アラート     ピップ単位のゾーン幅ラベル     MTF のもう 1 つのタイムフレーム。したがって、現在より 2 時間足高いのではなく、現在より 3 時間足し上に見えるようになります。     アラート/ゾーン/MTF 機能を有効/無効にするボタン あなたが得る利点:     取引から感情を取り除きます。     取引エントリをオブジェクト化します。     確率の高いセットアップで利益を上げましょう。     描画ゾーンから時間を節約します。
トレンドトレーディング は、タイミングのプルバックとブレイクアウトにより、市場で起こっているトレンドから可能な限り利益を得るように設計された指標です。確立されたトレンドの中で価格が何をしているかを分析することにより、取引の機会を見つけます。 [ インストールガイド | 更新ガイド | トラブルシューティング | よくある質問 | すべての製品 ] 自信を持って効率的に金融市場を取引する むち打ちにならずに確立されたトレンドから利益を得る 収益性の高いプルバック、ブレイクアウト、早期の逆転を認識する この指標は、独自の品質とパフォーマンスを分析します 複数時間枠のダッシュボードを実装します インジケーターは再描画されていません 電子メール/音声/視覚アラートを実装します 確立されたトレンドは多くの取引機会を提供しますが、ほとんどのトレンド指標はそれらを完全に無視しています。インジケーターの解釈はかなり簡単です: (1) トレンドの変化 (2) トレンドの方向への後退 (3) トレンドの方向へのブレイクアウト 赤いダッシュ は下降トレンド中の修正です 青いダッシュ は上昇トレンド中
Step into the world of Forex trading with confidence, clarity, and precision using   Gold Indicator   a next-generation tool engineered to take your trading performance to the next level. Whether you’re a seasoned professional or just beginning your journey in the currency markets, Gold Indicator equips you with powerful insights and help you trade smarter, not harder. Built on the proven synergy of three advanced indicators, Gold Indicator focuses exclusively on medium and long-term trends eli
MetaBands M4
Vahidreza Heidar Gholami
3.5 (6)
MetaBandsは、強力でユニークなアルゴリズムを使用してチャンネルを描画し、トレンドを検出して、トレーダーに取引の入出ポイントを提供することができます。チャンネル指標に加えて、強力なトレンド指標でもあります。入力パラメータを使用して新しいチャンネルを作成するために、異なるタイプのチャンネルを統合することができます。MetaBandsは、市場のイベントについてユーザーに通知するために、すべてのタイプのアラートを使用します。 特徴 ほとんどのチャンネルアルゴリズムをサポート 強力なトレンド検出アルゴリズム 異なるタイプのチャンネルを統合する能力 マルチタイムフレームおよびマルチカレンシー(シグナルマトリックス) すべてのタイプのアラート機能(サウンド、画面フラッシャー、プッシュ通知、メール、ポップアップ、矢印) 再描画しない トレンド検出 MetaBandsは、チャネル内を振動する青いラインを使用してトレンドを検出します。ラインがチャネルの上部バンドに達すると、下降トレンドの開始を示し、下部バンドに達すると上昇トレンドの開始を示します。青いラインが中心ラインに近づくと、市場はコンソリ
Current event:  https://c.mql5.com/1/326/A2SR2025_NoMusic.gif A. A2SR とは何ですか ?   * 先行テクニカル指標です (塗り直しなし、ラグなし)。 -- ガイダンス : -- https://www.mql5.com/en/blogs/post/734748/page4#comment_16532516 -- そして https://www.mql5.com/en/users/yohana/blog A2SR には、サポート (需要) とレジスタンス (供給) のレベルを決定する特別な手法があります。 ネットで見かける通常の方法とは異なり、A2SR は実際の SR レベルを決定する独自のコンセプトを持っています。 元の手法はインターネットから取得されたものではなく、インターネット上で公開されたこともありません。 A2SR は、取引スタイルに応じて SR レベルを自動選択します。 時間枠を変更しても、SR レベルはその位置にとどまります。 実際のSRは、使用する時間枠から取得されるわけではないため. A2SR
M30/H1/H4スイング版もあります M5/M15では取りきれない大きな波を狙いたい方へ。 Gold Signal Swing Pro(M30/H1/H4対応)を販売中。 1トレードで$20〜$80+の値幅を狙う。 https://www.mql5.com/en/market/product/177643 KURAMA GOLD SIGNAL PRO(MT4版)— 7層フィルター・自動TP/SL・品質スコア搭載 XAUUSD完全トレードシステム リペイントなし。リドローなし。ラグなし。すべてのサインは確定後に変わりません。見たままが結果です。 特典:買い切りライセンスをご購入いただいた方に、AI Zone Radar($59相当)+PDFマニュアルを無料プレゼント。購入後にMQL5でメッセージをお送りください。 AI Zone Radar: https://www.mql5.com/en/market/product/175834 トレーダーから信頼されています:ゴールドトレーダーのコミュニ
BTMM State Engine Pro is a MetaTrader 4 indicator for traders who use the Beat The Market Maker approach: Asian session context, kill zone timing, level progression, peak formation detection, and a multi-pair scanner from a single chart. It combines cycle state logic with a built-in scanner dashboard so you do not need the same tool on many charts at once. What it does Draws the Asian session range; session times can follow broker server offset or be set in inputs. Tracks level progression (L
Advanced Supply Demand
Bernhard Schweigert
4.91 (300)
現在40%オフ 初心者にもエキスパートトレーダーにも最適なソリューション このインジケーターは独自の機能と新しい公式を多数内蔵しており、ユニークで高品質かつ手頃な取引ツールです。このアップデートでは、2つの時間枠ゾーンを表示できるようになります。より長いTFだけでなく、チャートTFとより長いTF(ネストゾーンを表示)の両方を表示できます。すべてのSupply Demandトレーダーの皆さんのお気に召すはずです。:) 重要情報の公開 Advanced Supply Demandの可能性を最大化するには、 https://www.mql5.com/ja/blogs/post/720245 にアクセスしてください。   エントリーまたはターゲットの正確なトリガーポイントを正確に特定できれば取引がどのように改善されるか想像してみてください。新しい基盤となるアルゴリズムに基づいて構築されているため、買い手と売り手の間の潜在的な不均衡をさらに簡単に特定できます。これは、最も強い需要と供給のゾーンと、過去のパフォーマンス(古いゾーンを表示)がグラフィカルに表現されるためです。これらの機能は、最適な
Price & Time Market Structure Indicator A professional market structure tool that analyzes waves through both price and time — not price alone. Main Description NeoWave PRO is a professional market structure indicator for MetaTrader 4 designed for traders who want to move beyond traditional one-dimensional wave tools such as ZigZag, swing indicators, and basic high/low systems. Most wave indicators analyze only one thing: Price. But a real market wave is not only a price movement. A true wave de
このインジケーターは、反転ポイントと価格戻りゾーンを正確に表示します。     主要プレーヤー 。新たなトレンドが形成される場所を把握し、最大限の精度で意思決定を行い、すべての取引をコントロールします。 TREND LINES PRO インジケーターと組み合わせることで、その潜在能力を最大限に発揮します。 VERSION MT5 インジケーターが示す内容: 新しいトレンドの始まりに活性化する反転構造と反転レベル。 リスクと報酬の比率を最小限に抑えた利益 確定 と 損失停止の レベルの表示     RR 1:2   。 インテリジェントな削減ロジックによるストップロス。 指定されたインジケーターから 2 つのトレンド タイプの反転パターンを表示します。 指標: トレンドを追う   TREND LINES PRO   (世界的なトレンドの変化) TREND PRO   (クイックトレンド変更) シンプルで効果的   スキャナー   リアルタイムトレンド(新機能)。 マルチタイムフレームのインストゥルメント フィルタリング。 画面   利益     LOGIC AI信号の後。 当日プラス方
Quant Direction
Georgios Kalomoiropoulos
Quant Direction は、3次元の市場分析ツールです。完全に客観的なアルゴリズムベースの市場分析を提供し、様々なパラメータにわたる正確なパーセンテージ偏差を同時に算出します。高度なAI搭載モデリングツールで開発され、厳密なテストを経て開発されたこのアルゴリズムは、かつてない精度で市場を分析するように設計されています。プラットフォーム上では、あらゆる通貨ペアや金融商品を分析できます。 短期取引、デイトレード、スイングトレードなど、どのような取引スタイルに も、Quant Directionは最適な選択肢です。 オペレーターの本当の利点 Quant Directionの真の利点は、感情、眼精疲労、過剰分析を完全に排除できる点にあります。方向性を探るために何十ものチャートを手作業で精査したり、自分の好みを常に疑ったりする必要がなくなります。このシステムは、8つの時間間隔(5ヶ月から月単位まで)をミリ秒単位で処理します。あらゆる瞬間に市場を支配している主体を正確に明らかにし、常に成功確率が最も高い方向で取引できるようにします。 市場分析の3つの側面 このアルゴリズムは市場を3つの
MonsterDash Harmonic Indicator is a harmonic pattern dashboard. It recognizes all major patterns. MonsterDash is a dashboard that displays all detected patterns for all symbols and (almost) all timeframes in sortable and scrollable format. Users can add their own user defined patterns . MonsterDash can open and update charts with the pattern found. Settings MonsterDash's default settings are good enough most of the time. Feel free to fine tune them to your needs. The color settings are for thos
Apollo SR Master は、サポート/レジスタンスゾーンを利用した取引をより容易かつ確実にする特別な機能を備えたサポート/レジスタンスインジケーターです。このインジケーターは、ローカル価格の高値と安値を検出することで、タイムラグなしでリアルタイムにサポート/レジスタンスゾーンを計算します。そして、新たに形成されたSRゾーンを確認するために、インジケーターは特別なシグナルを表示します。このシグナルは、SRゾーンを実際の売りまたは買いシグナルとして考慮して使用できることを示します。この場合、SRゾーンの強度が高まり、SRエリアからの取引が成功する確率も高まります。これがこのインジケーターの基本的な考え方です。 SRゾーンは、ストップロスとテイクプロフィットの設定を容易にします。シグナルの方向に応じて、SRゾーンの上または下のスペースをストップロスとして設定できます。さらに、反対側のSRゾーンは、潜在的なテイクプロフィットエリアとして設定できます。 また、Apollo SRマスターインジケーターをご利用のすべてのユーザーには、「Apollo Price Action System」
現在40%オフ 初心者やエキスパートトレーダーに最適なソリューション! このインジケーターは、独自の機能と新しい計算式を取り入れた、ユニークで高品質、かつ手頃な価格のトレーディングツールです。たった1枚のチャートで28の為替ペアの通貨強度を読み取ることができます。新しいトレンドやスキャルピングチャンスの引き金となるポイントを正確に特定することができるので、あなたのトレードがどのように改善されるか想像してみてください。 ユーザーマニュアルはこちら  https://www.mql5.com/en/blogs/post/697384 これが最初の1本、オリジナルだ! 価値のないクローンを買わないでください。 特別な サブウィンドウの矢印で強い通貨の勢いを表示 GAPがあなたのトレードを導く! 基準通貨や気配値が売られすぎ・買われすぎのゾーン(外相フィボナッチレベル)にあるとき、個別チャートのメインウィンドウに警告表示。 通貨がレンジの外側から反落した場合、プルバック/リバーサルのアラート。 クロスパターンの特別なアラート 複数の時間枠を選択可能で、トレンドを素早く確認できます
Auto Optimized Parabolic RSI: 高度な3Dモメンタムエンジン ほとんどのリテール向けインジケーターは、市場のボラティリティが変化した瞬間に破綻する静的な入力値に依存しているため、失敗に終わります。Auto Optimized Parabolic RSIは、自らの数学的優位性を継続的に再計算することで「インジケーターの陳腐化」問題を解決し、機関投資家レベルの定量的適応力をMT5ターミナルに直接もたらします。 最大の強み: カスタムインメモリ3D最適化   標準的な自動最適化ツールは、インジケーターの呼び出しで端末に過負荷をかけるため、頻繁にMT5プラットフォームをフリーズさせます。本ツールは、このボトルネックを完全に回避しています。RAMベースのカスタムネイティブ計算機を内蔵した内部エンジンは、チャートを読み込んだりタイムフレームを変更したりするたびに、超高速の3Dグリッド探索を実行します。RSI期間(頻度)、SARステップ(加速度)、SAR最大値(制限速度)を同時にスイープし、プラットフォームを遅延させることなく、数万通りものパラメーターの組み合わせを絶対的
123パターン は、最も人気のある強力で柔軟なチャートパターンの1つです。このパターンは、3つの価格ポイントで構成されています。ボトム、ピークまたはバレー、および38.2%〜71.8%のフィボナッチリトレースメントです。パターンは、価格が最後のピークまたは谷、インディケーターが矢印をプロットし、アラートを上昇させ、取引を行うことができる瞬間を超えたときに有効と見なされます。 [ インストールガイド | 更新ガイド | トラブルシューティング | よくある質問 | すべての製品 ] クリアな取引シグナル カスタマイズ可能な色とサイズ パフォーマンス統計を実装します カスタマイズ可能なフィボナッチリトレースメントレベル 適切なストップロスおよび利益レベルを表示します インジケーターを使用して、継続パターンまたは反転パターンを見つけることができます 再描画および非再描画ではありません 電子メール/音声/視覚アラートを実装します 123パターン は、継続パターンまたは反転パターンとして現れます。物事を簡単にするために、このインジケーターを使用して、検索するパターンのタイプを選択できるため
After purchase, contact me privately to receive 1 month of free testing with EA Forex Proton! This advanced MT4 trading robot automatically executes signals from any MT4 indicator, including Market Makers. The latest version also includes AI integration, allowing each trade signal to be analyzed using Artificial Intelligence. Live Signal with EA Forex Proton: Click here Market Makers is a powerful price action trading system designed to identify high-probability Buy and Sell opportunities based
作者のその他のプロダクト
This indicator provides the technical overview using following tools: Pivot Points Technical Indicators Moving Averages Pivot Points are calculated using five different methods: Classic Fibonacci Camarilla Woodie DeMark With the technical indicator , you can find the trading signals using the combination of different indicators. It supports the following technical indicators: RSI Stochastic Stochastic RSI MACD ADX CCI ATR Ultimate Oscillator ROC Bull/Bear Power Moving Averages is used to find th
Contact us for any custom order,   CodeYourTrade.com . Channel Breakout indicator shows the channels based on the number of bars. It is used to trades the breakouts or reversals. Breakout is quite efficient, since it tries making profit when the market crashes!! You can also invent your own technique out of it. After you attach the indicator to a chart it will show the following information on the chart: 1.     Channel 1 and channel 2 information 2.     Alert and email information   You can hid
Contact us for any custom order,   CodeYourTrade.com . Candle Close Time indicator is used to track the time remaining or passed on a current candle at any point of time. To get notified set the time in format DD:HH:MM:SS. For example : EnableNotify = true & (Day Left : Hour Left : Minute Left : Second Left) = 00:02:20:20. Let’s say remaining time to close candle is 00:03:23:21 (DD:HH:MM:SS). Now, when the time remaining reaches below 00:02:20:20, it shows an Alert box. You can hide all the inf
Continuous Bars indicator is used to track the continuous bars closed in one direction. For example : Continuous Bars = 3 (we are looking for 3 continuous bars) Now, if (Open > Close) or (Close > Open) for 3 continuous bars it is notified via email or alert. You can hide all the information displayed in the chart by setting  false  to  Show On Chart . Indicator Settings: Main Setting Bars : Number of continuous bars we are looking Price Setting Use M1 Timeframe: Look for continuous bars in M1 ti
Contact us for any custom order,   CodeYourTrade.com . Currency Sessions Highlight indicator is used to highlight the sessions. The maximum number of sessions visible at a time is 3. A user has to input the input the start and end time of the session in the format HH:MM. You can hide all the information displayed in the chart by setting  false  to  Show On Chart . Indicator Settings: Main Setting Show Session 1 : Draw Session 1 on chart or not Session 1 Start : Start time of the session 1 Sessi
Contact us for any custom order,   CodeYourTrade.com . Keltner Channels are volatility-based envelopes. Moving average dictates direction and the ATR sets the channel width. It’s a trend following indicator used to identify reversals. Channels can also be used to identify overbought and oversold levels when the trend is flat. Trading Strategy We have created 2 zones SELL ZONE and BUY ZONE using the Keltner channels. In SELL ZONE (upper) we take only sell orders and in BUY ZONE (lower) we take
Contact us for any custom order,   CodeYourTrade.com . The MACD Histogram measures the distance between the MACD line and the MACD signal line. Two important terms are derived from the MACD histogram are: ·          Convergence : The MACD histogram is shrinking in height. This occurs because there is a change in direction or a slowdown in the trend. When that occurs, the MACD line is getting closer to the MACD signal line. ·          Divergence : The MACD histogram is increasing in height (eith
Contact us for any custom order,   CodeYourTrade.com . Multiple Moving Average (MA) indicator is used to find the direction of the trend using multiple Moving Average indicators. It calculates using the following rules: ·          Ask < MA, it is SELL ·          Bid > MA, it is BUY ·          Ask > MA > Bid, it is None (no signal) After you attached the indicator to a chart it will show the following information on the chart: Multiple MAs arranged by their method Buy and Sell count Summary: Con
Contact us for any custom order,   CodeYourTrade.com . This indicator is used to calculate the pivot points using 5 different methods: Classic Fibonacci Camarilla Woodie DeMark After you attached the indicator to a chart it will show the following information on the chart: Pivot points levels of the current chart using different methods. Indicator Setting Pivot Point Calculator Show Pivot Point Calculator: Show all pivot points on chart Pivot Points Timeframe: It tells which time is used to cal
Spread & Swap Indicator is used to check the spread and swap for the current pair. You can hide all the information displayed in the chart by setting  false  to  Show On Chart . Indicator Settings: Main Setting Display Spread : Shows the spread of the current pair. Display Swap (per lot) : Show the swap charges per lot for the current pair. Display Setting Display : Shows the indicator information on chart Location : Location of the display window Top-Left : Display all the details in top-left p
With the Technical Analysis indicator, you can find the trading signals using the combination of different technical indicators. It supports the following technical indicators: 1.     RSI 2.     Stochastic 3.     Stochastic RSI 4.     MACD 5.     ADX 6.     CCI 7.     ATR 8.     Ultimate Oscillator 9.     ROC 10.   Bull/Bear Power After you attached the indicator to a chart it will show the following information on the chart: 1.     Technical indicators, their values and the signal generated fro
Contact us for any custom order,   CodeYourTrade.com . With the Technical Indicator Multi-Timeframe, you can easily identify the oversold/overbought levels or buy/sell levels points on several different timeframes by using only one chart. You can confirm Short Term trades by higher timeframe Levels. It supports 4 technical indicators as of now Stochastic, RSI, Parabolic SAR & Heiken Ashi. After you attached the indicator to a chart it will show the following information on the chart: Timeframe:
Contact us for any custom order,   CodeYourTrade.com . Trade Notifier indicator is used to notify opening or closing of the trades via email or alert. It can also send regular trade updates via email. After you attached the Indicator to a chart, it will show the following information on the chart: 1.     Alert information 2.     Email information 3.     Details to include in email body You can hide all the information displayed in the chart by setting  false  to  Display . Indicator Settings Al
Contact us for any custom order,   CodeYourTrade.com . Trend Direction indicator finds the direction of the trend using 2 indicators ADX and Parabolic SAR. Change the color of the Sell and Buy strength from the Colors tab in indicator settings. After you attached the indicator to a chart it will show the following information on the chart: 1.     Parabolic SAR: Input values of Parabolic SAR Indicator 2.     ADX: Input values of ADX Indicator 3.     Trend Strength: Direction of the trend
Contact us for any custom order,   CodeYourTrade.com . Martingale EA is a multicurrency Expert Advisor using martingale or grid technique to trade the market. Trading strategy: Manual Entry + Automated Trade Management Manual Entry : User can input the starting trade type in the EA based on their analysis. The EA has no intelligence of its own to decide the entry trade type. Intelligence can be added in the EA upon request. Automated Trade Management : It manages the trade using martingale or gr
Contact us for any custom order, CodeYourTrade.com . Timed Close EA is used to close all the trades automatically at your specific time. You can set the EA using any of the 3 options: 1.     OneTime: In this option EA will run only once. Execute at that date-time and stops. 2.     Weekly: In this option EA will run at specific day-time every week. For example if you wanted to close all the trades before market close at Friday, you can use this option. 3.     Daily: In this option EA will run da
Contact us for any custom order,   CodeYourTrade.com . The main use of Straddle EA is to trade at the major fundamental news events. It opens 2 pending orders Buy Stop and Sell Stop to capture the market single direction movements at the time of news. The EA will run from "News Time – Seconds before News Time" to "Expiration Time". These are the sequence of states in the EA: Waiting : Before "News Time – Seconds before News Time". The EA is waiting to start. Passed : The EA started and trade ex
Contact us for any custom order,   CodeYourTrade.com . Profit and Loss Manager EA is to close the running or pending trades when reached to a specified profit or loss. EA works fully on virtual mode i.e. no hard Stop Loss or Take profit set. You can run the EA in any of the 3 modes: 1.     Per Trade : In this mode, actions are applied to all the trades separately. Rules are applied on a single trade separated, it’s profits/loss not combined with any other trades. 2.     Per Pair : In this mode
Contact us for any custom order,   CodeYourTrade.com . Partial Close EA is used to partially close running trades. EA has an option to filter out the trades and works only on specific trades. Following are the filters for the EA: 1.     Magic Number: Have an option to works on all orders with the given magic number 2.     Order Number: Can work specifically on the single order with the given order number 3.     Chart: Can work for all the trades of the current attached chart Example : Let’s say
Contact us for any custom order,   CodeYourTrade.com . Brent Wti spread indicator shows the difference of Brent and Wti value. Trading Strategy: Identify the range of spread movement. To buy the difference execute these 2 trades “Buy BRENT and Sell WTI” To sell the difference execute these 2 trades “Sell WTI and Buy BRENT”   Indicator Settings: Main Setting Indicator Maximum : Maximum level to show in indicator Indicator Minimum : Minimum level to show in indicator Brent Symbol Name : Symbol na
フィルタ:
レビューなし
レビューに返信