Raff Channel MT5
- Indikatoren
-
Andrey Kaunov
 Привет, меня зовут Андрей Каунов. Я специализируюсь на создании экспертов, индикаторов и скриптов для платформы Meta Trader 4/5. Мой опыт программирования составляет более 18 лет. Считаю, что любую идею можно воплотить в коде. Я имею опыт реальной торговли, поэтому выполняю техническое задание
 - Version: 1.1
- Aktivierungen: 10
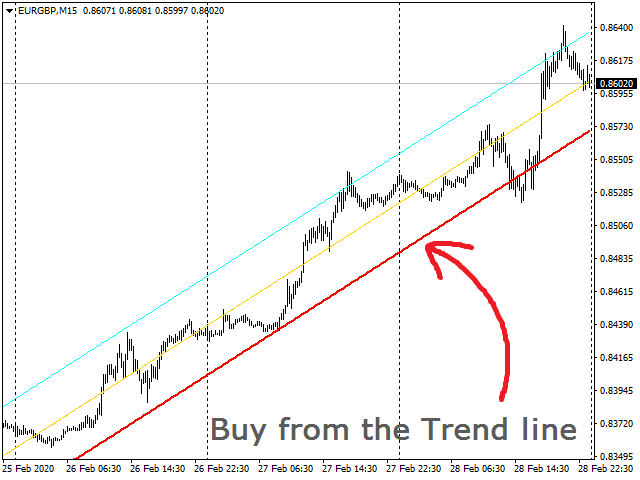
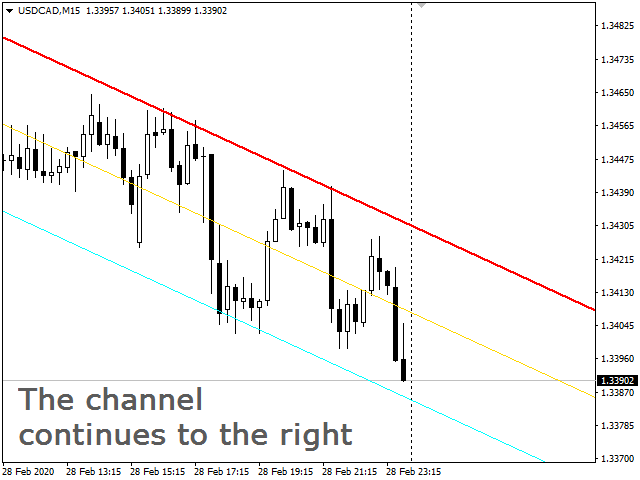
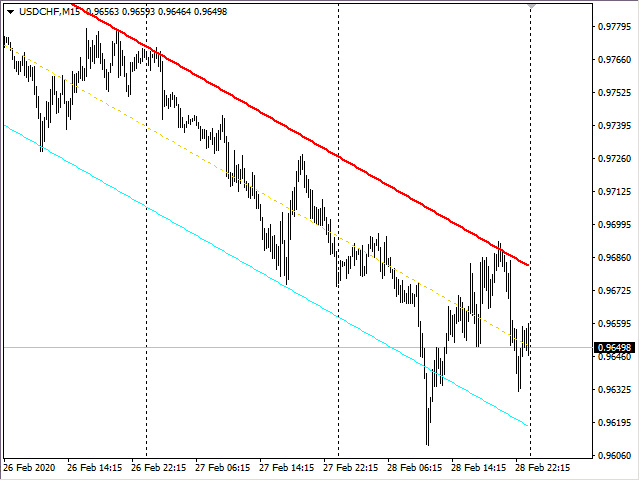
Индикатор строит канал Раффа на основе линейной регрессии. Красная линия тренда может использоваться для принятия решения о покупке или продаже внутрь канала при подходе цены к ней. Настройками можно задать ширину канала по коэффициенту отклонения от базовой линии или по максимальному и минимальному экстремуму. Так же можно включить продолжение канала вправо от текущих цен.
Индикатор канала регрессии Раффа - удобный инструмент, значительно облегчающий работу современного трейдера. Он может быть задействован практически на любом графике, возможно в связке с другими индикаторами.
Eingabeparameter:
Anzahl der zu berechnenden Balken - Die Anzahl der Balken in der Historie, beginnend mit dem aktuellen, um den Kanal zu zeichnenAbweichung der Trendlinie - Koeffizient der Abweichung der TrendlinieWiderstandslinie Abweichung - Koeffizient der Abweichung der WiderstandslinieUse Trend line Deviation - true: die Trendlinie basiert auf dem Koeffizienten, false: die Trendlinie basiert auf dem ExtremwertUse Resistance line Deviation - true: die Widerstandslinie wird durch einen Koeffizienten gebildet, false: die Widerstandslinie wird durch ein Extrem gebildetExtend channel to the right (Kanal nach rechts erweitern) - Den Kanal nach rechts fortsetzen (Strahl nach rechts)Breite der Basislinie - Breite der RegressionsbasislinieFarbe der Basislinie - Die Farbe der RegressionsbasislinieTrendlinienbreite - Die Breite der TrendlinieTrendlinienfarbe - Die Farbe der TrendlinieBreite der Widerstandslinie - Die Breite der WiderstandslinieFarbe der Widerstandslinie - Die Farbe der Widerstandslinie
Indikatorpuffer (für Programmierer):
   SetIndexBuffer(0,Base_line);
   PlotIndexSetDouble(0,PLOT_EMPTY_VALUE,0.0);
   PlotIndexSetString(0,PLOT_LABEL,"Base Line");

   SetIndexBuffer(1,Trend_line);
   PlotIndexSetDouble(1,PLOT_EMPTY_VALUE,0.0);
   PlotIndexSetString(1,PLOT_LABEL,"Trend Line");

   SetIndexBuffer(2,Res_line);
   PlotIndexSetDouble(2,PLOT_EMPTY_VALUE,0.0);
   PlotIndexSetString(2,PLOT_LABEL,"Resist Line");