Kch Channel
- Indikatoren
- Version: 1.0
- Aktivierungen: 5

Keltner Channels (KC) ist ein gleitender Durchschnittskanal, der aus einer Kombination von drei Linien (oberer, mittlerer und unterer Kanal) besteht. Wenn der Aktienkurs an den Grenzen unregelmäßig schwankt, deutet dies auf eine Kauf- oder Verkaufsmöglichkeit hin. KC ist ein Indikator, der auf dem Prinzip der durchschnittlichen wahren Volatilität beruht und sehr gut auf Kursschwankungen reagiert. Er kann Bollinger Bands oder Prozentbänder als neues Instrument zur Marktbeurteilung ersetzen.
Der Keltner-Kanal besteht aus zwei Bändern, die um einen linear gewichteten gleitenden Durchschnitt schwanken, wobei der Parameterkanal des linear gewichteten Durchschnitts 20 beträgt. Der Kurs bricht über und unter die obere und untere Linie der Bänder aus und erzeugt so in der Regel ein Long- oder Short-Handelssignal. Der Erfinder des Indikators, Chester Keltner, wurde von Linda Raschke optimiert und verbessert, die einen linear gewichteten Durchschnitt von 10 Einheiten verwendete. Sie verwendet einen linear gewichteten SMA von 10 Einheiten zur Berechnung der durchschnittlichen wahren Volatilität (ATR).
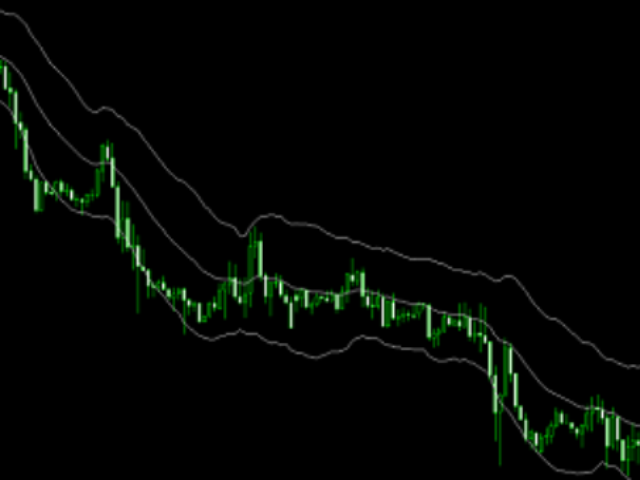
Zusammensetzung der Keltner-Kanäle Keltner-Kanäle:
Ein einfacher Keltner-Kanal enthält drei Linien: die mittlere Linie, die obere Schiene und die untere Schiene.
Die mittlere Linie ist der EMA (20), der 20-Tage-EMA-Durchschnitt des Kurses.
Obere Schiene = Mittlere Linie + 2*ATR(10)
Untere Schiene = Mittlere Linie - 2*ATR(10)
Die obige Darstellung ist der optimierte kc-Kanal. Anfangs verwendete sein Erfinder Chester Keltner den einfachen 10-Tage-Durchschnitt SMA(10), um die mittlere Linie zu berechnen, und den Durchschnitt der 10-Tage-Hoch- und Tiefstkurse, um den Abstand zwischen der mittleren Linie und der oberen und unteren Schiene zu berechnen. Dieser Indikator wurde jedoch später von Linda Raschke optimiert, die das Konzept der ATR, d. h. der Averagetrue Range, einführte.