KT Power Pennant MT5
- Indikatoren
-
KEENBASE SOFTWARE SOLUTIONS
 Keenbase Trading entwickelt professionelle MetaTrader 4- und MetaTrader 5-Indikatoren sowie Expert Advisors, die Trader dabei unterstützen, fundiertere Handelsentscheidungen zu treffen.
 - Version: 1.0
- Aktivierungen: 10
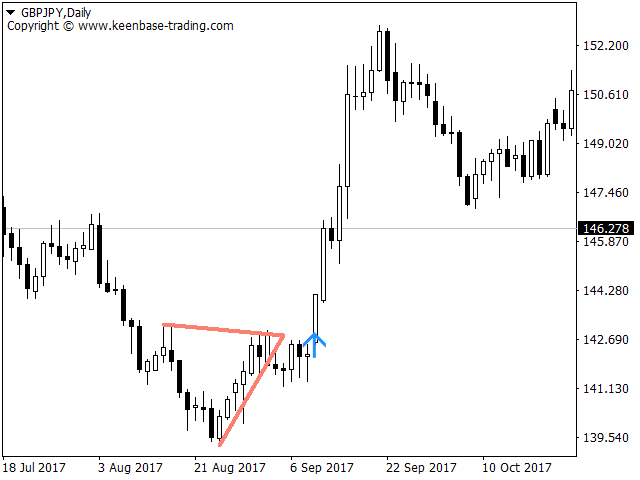
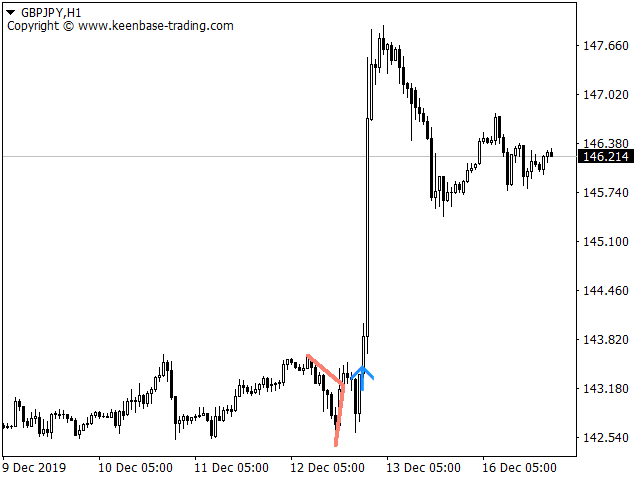
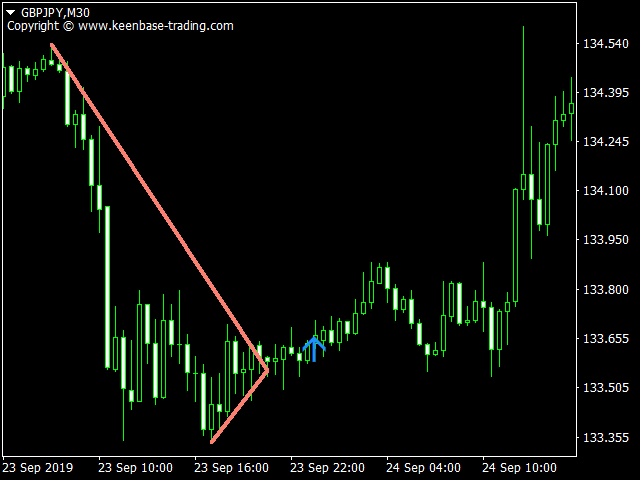
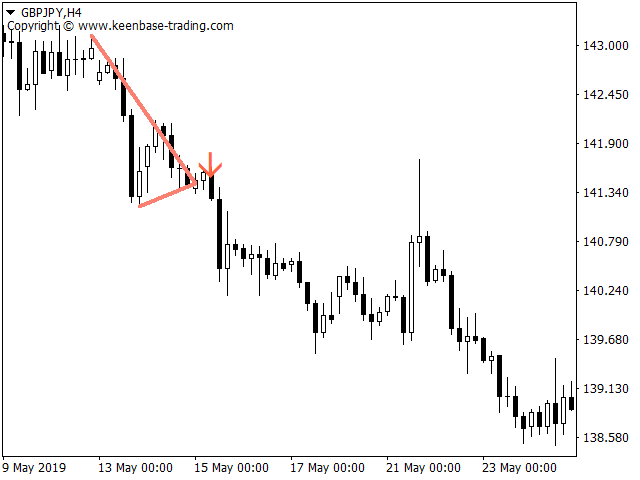
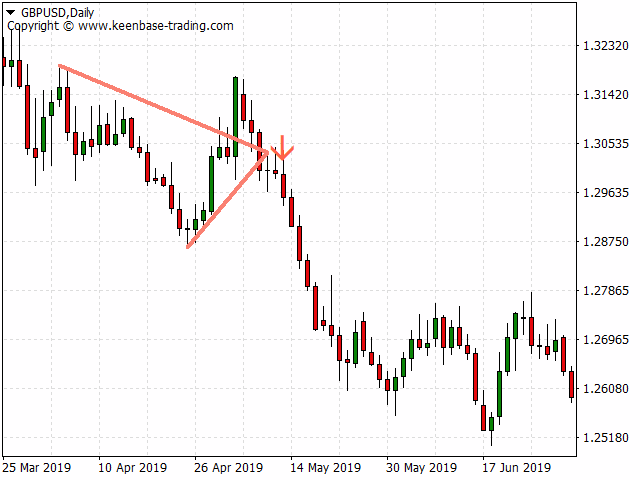
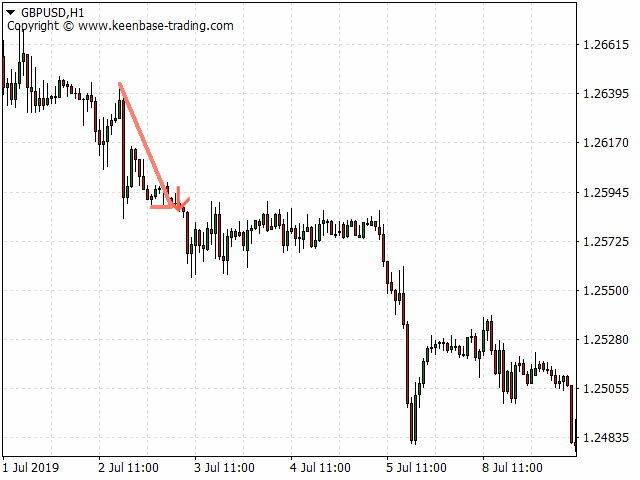
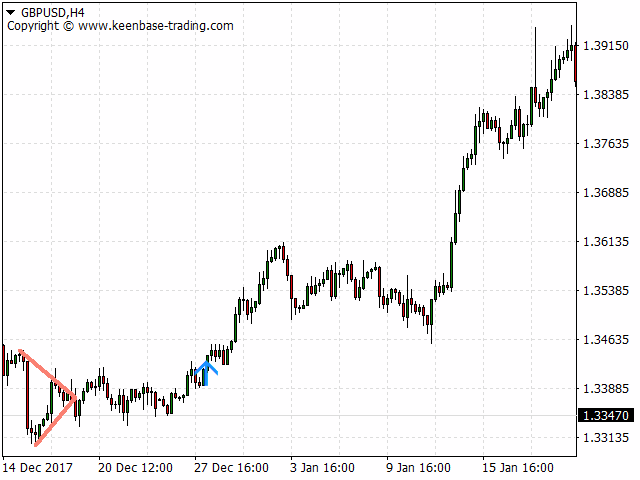
KT Power Pennant erkennt und markiert das bekannte Wimpel-Muster im Chart. Ein Wimpel ist ein Trendfortsetzungsmuster mit einer starken Kursbewegung in eine Richtung, gefolgt von einer Konsolidierungsphase mit sich verengenden Trendlinien.
Sobald ein Wimpelmuster erkannt wurde, wird ein Kauf- oder Verkaufssignal durch einen bullischen oder bärischen Ausbruch nach der Formation generiert.
Funktionen
- Wimpelmuster bieten einen risikoreduzierten Einstieg nach einer Konsolidierung, gefolgt von einem Ausbruch.
- Kombiniert mit anderen Methoden der technischen Analyse können die Signale von KT Power Pennant einen klaren Vorteil bringen.
- Eine Konsolidierung mit geringem Volumen, gefolgt von einem Ausbruch mit zunehmendem Volumen, erhöht die Wahrscheinlichkeit einer Trendfortsetzung.
- Alle Metatrader-Benachrichtigungen sind integriert.
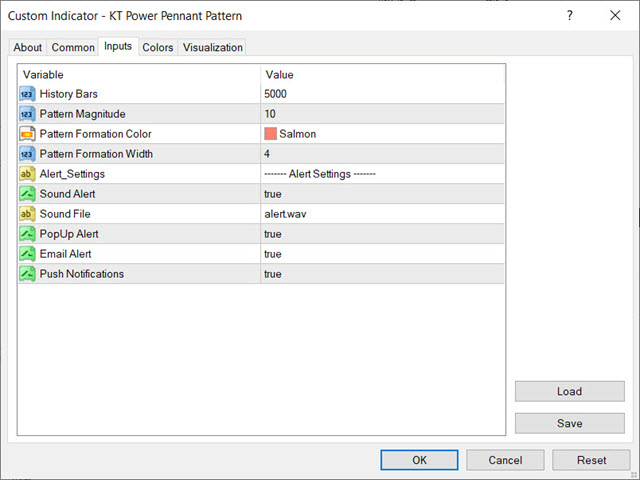
Eingabeparameter
- Historische Balken: Anzahl der Balken zur Erkennung historischer Wimpelmuster.
- Mustergröße: Ganzzahl, die die Größe und Ausprägung des Wimpelmusters bestimmt.
- Farbe der Musterbildung: Farbe der Trendlinien, die das Muster bilden.
- Linienstärke der Musterbildung: Breite der Trendlinien, die das Muster darstellen.
- Die restlichen Parameter sind selbsterklärend.