Fractal SR Clusters
- Indikatoren
- Version: 1.2
- Aktualisiert: 28 März 2020
- Aktivierungen: 5

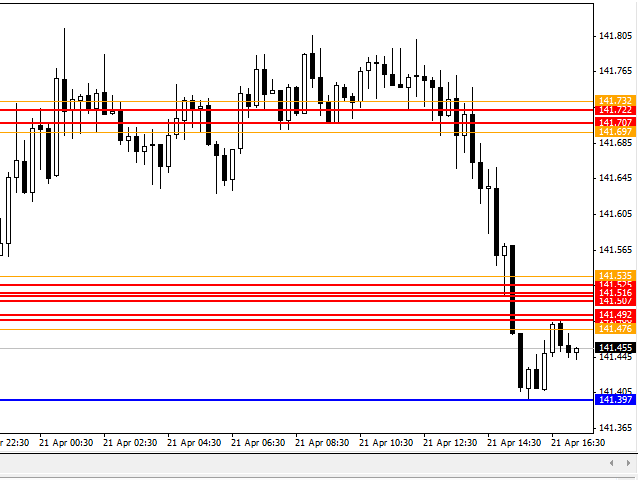
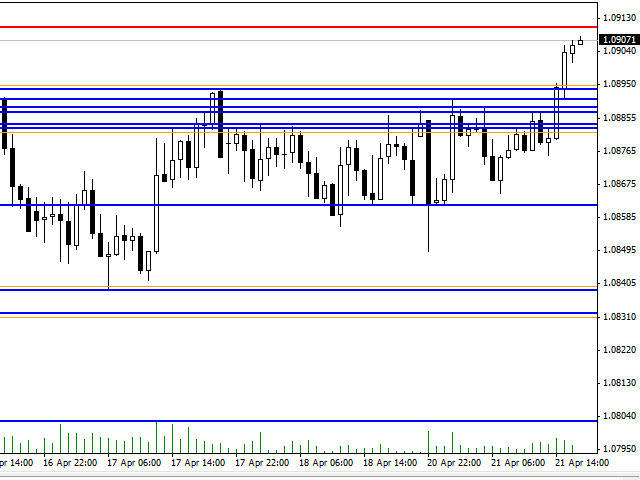
Fractal Support/Resistance Clusters ist ein Indikator, der Unterstützungs- und Widerstandslinien auf der Grundlage von Fraktalen zeichnet, deren Quellen noch nicht gebrochen wurden und daher noch relevant sind. Ein Fraktal ist als Indikator für Unterstützung oder Widerstand relevant, wenn der Preis seines vorherigen Gegenfraktals noch nicht gebrochen wurde.
Cluster von Unterstützungs- und Widerstandszonen werden mithilfe des dichtebasierten räumlichen Clustering von Anwendungen mit Rauschen (DBSCAN-Algorithmus) abgeleitet und können auf dem Bildschirm eingezeichnet werden. Diese Cluster verwenden die Standardabweichung des Preises als Grenzwerte. Weitere Informationen über den Algorithmus selbst finden Sie auf der Wikipedia-Seite: http://en.wikipedia.org/wiki/DBSCAN
Falls gewünscht, können Warnmeldungen aktiviert werden, um den Benutzer über einen Ausbruch nach oben oder unten zu informieren, sobald dieser auftritt. Ein Ausbruch ist definiert als ein Fall, in dem der Schlusskurs des vorherigen Balkens außerhalb eines Clusters liegt, während der Schlusskurs des davor liegenden Balkens innerhalb eines Clusters liegt. Ausbrüche können entweder durch einen willkürlichen Punktbruch oder relativ zur Standardabweichung des Kurses auf der Grundlage der Cluster-Einstellungen definiert werden.
Für allgemeine Zwecke sollten die Standardeinstellungen ausreichen.
Parameter
Hauptindikator-Einstellungen:
- LookBack - die Anzahl der Balken, die zurückgeschaut werden, um relevante Fraktale zu finden
- SupportColor - die Farbe der Unterstützungslinien
- ResistanceColor - die Farbe der Widerstandslinien
- SRLineWidth - die Breite der Unterstützungs- und Widerstandslinien
- ShowPrice - wenn true, wird der Preis auf der rechten Seite des Fensters angezeigt
Cluster-Einstellungen:
- ShowClusters - ob Cluster überhaupt berechnet werden sollen
- StdDevPeriod - der Zeitraum, der für die Ableitung der Standardabweichung des Kurses verwendet wird
- StdDevSigma - der Betrag, mit dem die Standardabweichung multipliziert werden soll
- DrawBoundsByStdDev - wenn true, dann werden die Grenzen für Clusterregionen basierend auf dem Abstand gezogen, um den eine Clusterregion nach weiteren Mitgliedern sucht; dies wird für größere Zeitrahmen empfohlen
- PointDistance - der Abstand in Punkten, der zum Zeichnen von Grenzen für Clusterregionen verwendet werden soll; dies wird verwendet, wenn der vorherige Parameter auf false gesetzt ist, und wird für kleinere Zeitrahmen empfohlen
- ClusterColor - die Farbe der Begrenzungslinien des Clusters
- ClusterLineWidth - die Breite der Linien der Clusterregion
Alert-Einstellungen:
- AlertOnBreakout - benachrichtigt den Benutzer, wenn es einen Cluster Breakout gibt