Hi Low Last Day
- Indikatoren
-
Igor Vishnevskii
 My age is 50+, in trade 20+ years. I was lucky that at the beginning of my trading career there were experienced mentors who laid the fundamental concepts of the market in my mind. Almost all of my trading strategy is based on the price (level) of the instrument. As a result of my trading strategy
 - Version: 2.3
- Aktualisiert: 16 November 2024
- Aktivierungen: 5
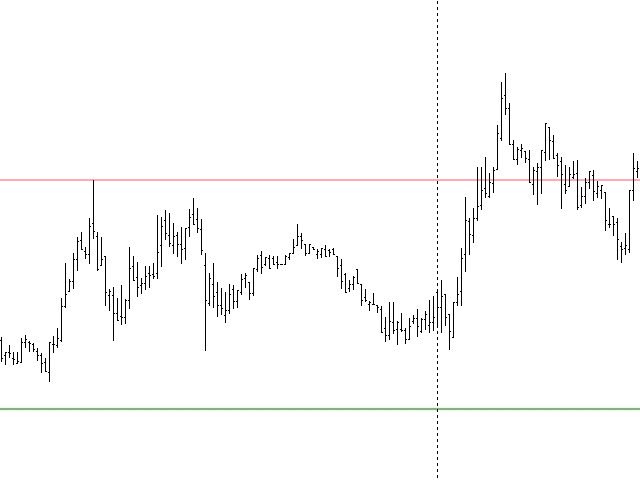
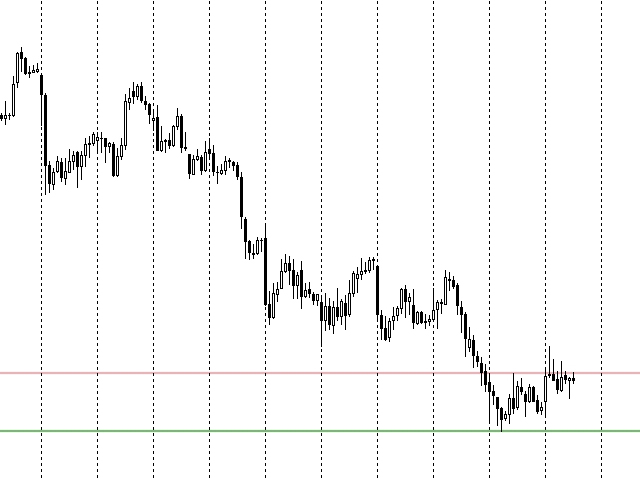
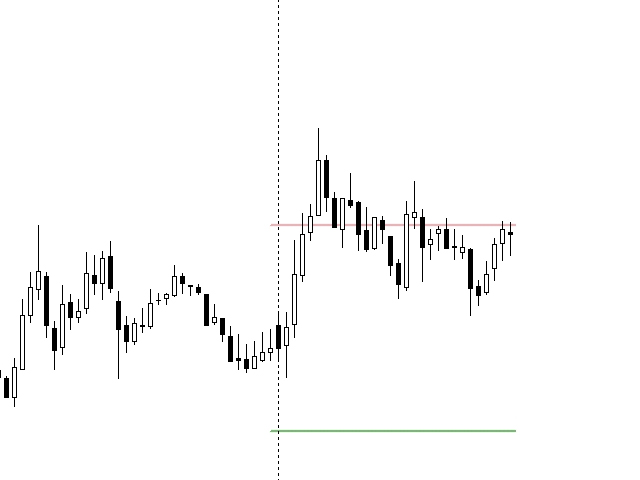
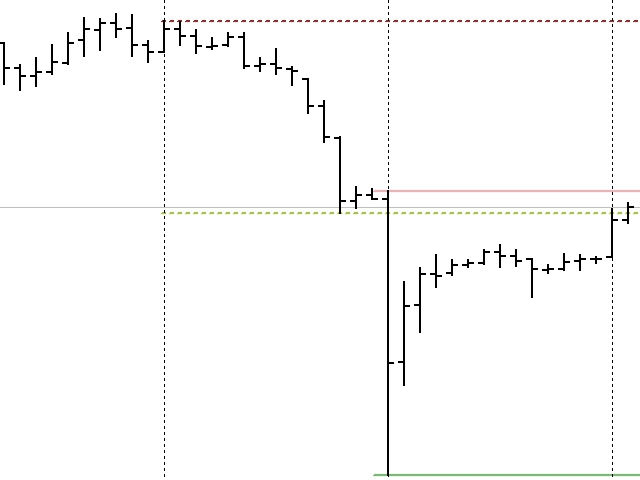
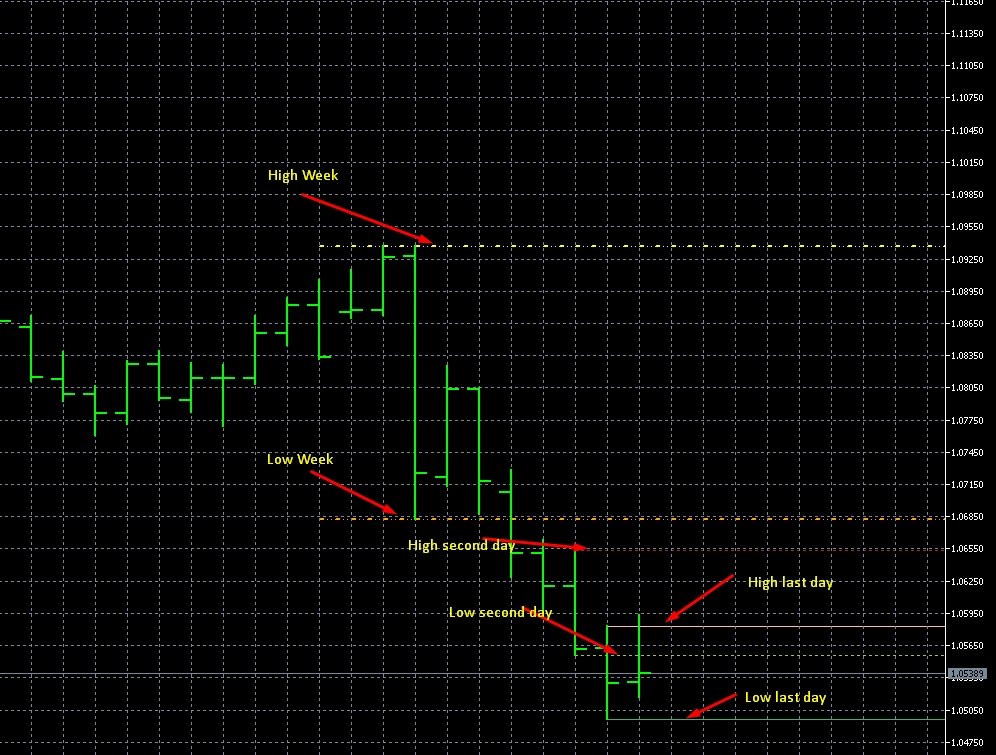
Der Indikator Hi Low Last Day (Hi Lo Last Day) zeigt den Höchst- und Tiefstwert des letzten und des zweiten Handelstages an, sowie das Minimum und Maximum der letzten Woche.
Es gibt viele Handelsstrategien, die auf den Tageswerten basieren. Dieser Indikator ist bei der Anwendung solcher Handelsstrategien unverzichtbar.
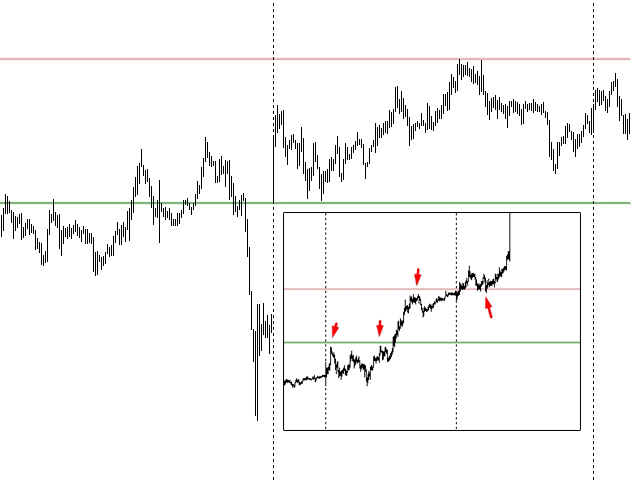
In der Tat ist alles einfach im Handel, Sie müssen es nur verstehen und für sich selbst akzeptieren. Es gibt nur einen Preis!!! Was ist der Preis? Das ist das Niveau auf dem Chart. Das Niveau ist der Preis, den der Käufer und der Verkäufer zurückhalten. Welcher Preis wird von der Gegenpartei gedeckelt? Ein Preis, den er weder verkaufen noch kaufen will. Daher sind die Tageskurse sehr wichtig. Um die Situation auf dem Markt zu verstehen, können Sie den Hi Low Last Day-Indikator verwenden, der Ihnen hilft, die Stimmung auf dem Markt für den aktuellen Tag zu bestimmen.
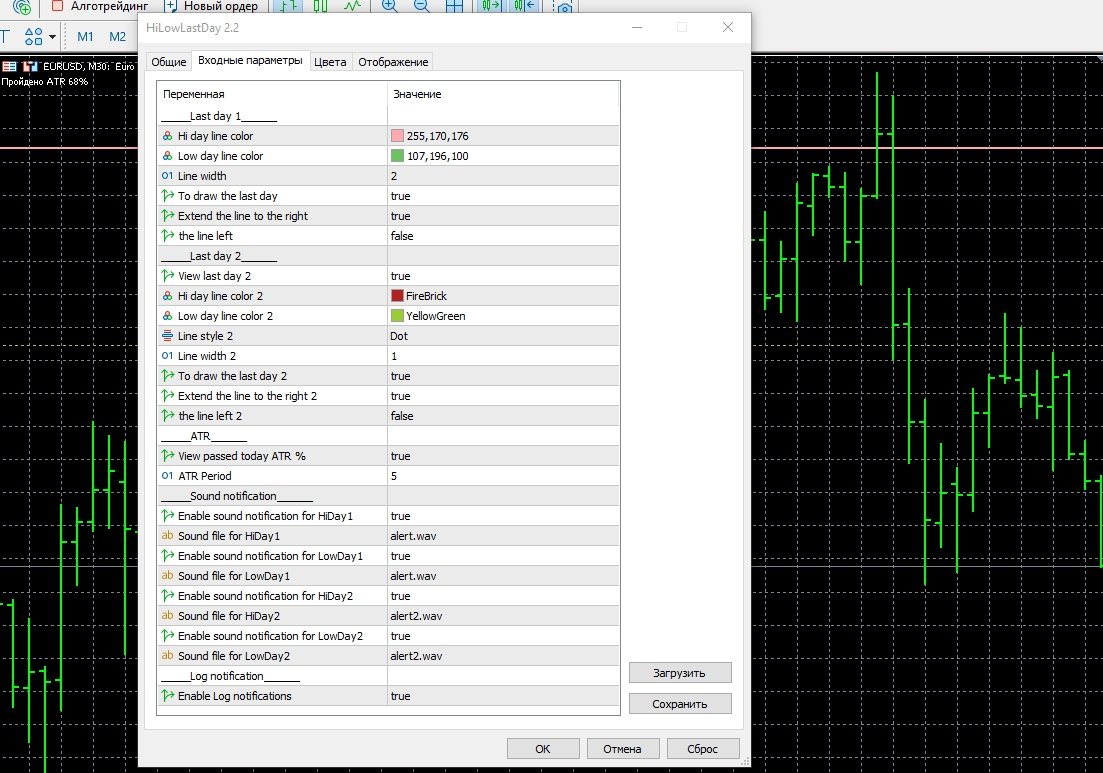
Der Hi Low Last Day-Indikator hat flexible Einstellungen:
- Farbe der Linie
- Breite der Linie
- Stil der Linie
- Art der Anzeige (Länge der Linien)
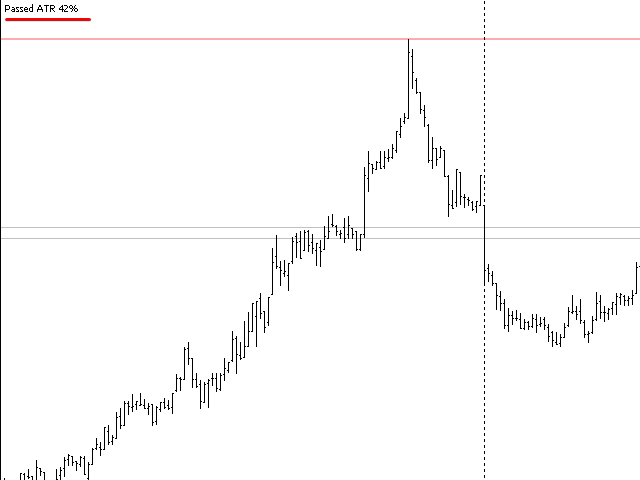
- Heute überschrittene ATR
- Der ATR-Zeitraum
- Zur Anzeige des zweiten Tages
- Der zweite Tag
- Das Setupder letzten Woche
Der Indikator benötigt sehr wenig Systemressourcen und lädt das Terminal nicht.