SSACD Forecast Limited Edition
- Indikatoren
-
Roman Korotchenko
 Резюме опубликовано
http://itmozg.ru/resume/show/?id=572d5c129f5255221bb43c3f - Version: 2.55
- Aktualisiert: 25 November 2021
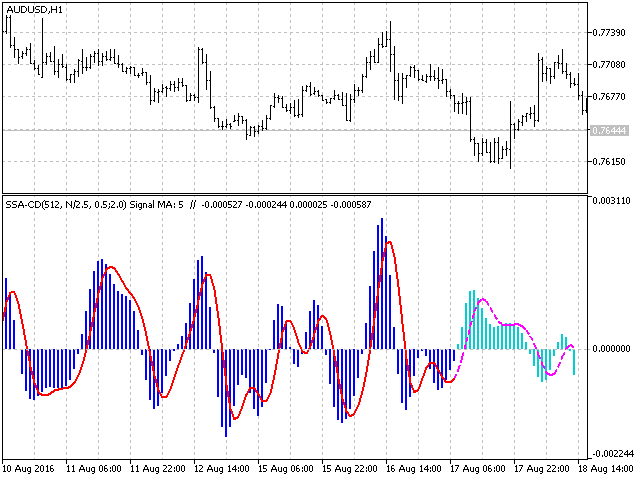
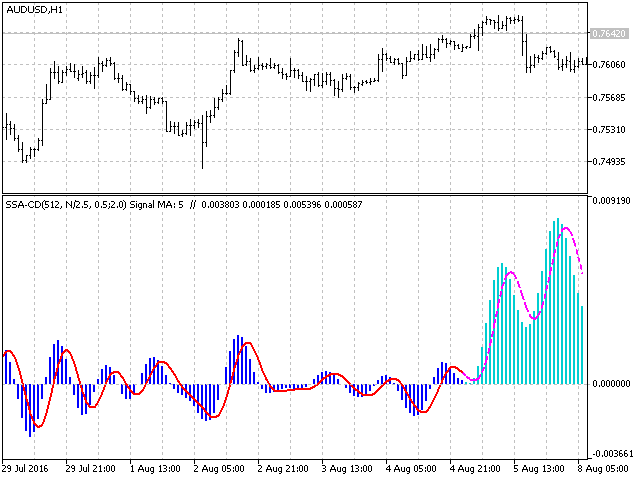
SSACD - Singular Spectrum Average Konvergenz/Divergenz
Dies ist ein Analogon des MACD-Indikators, das auf der Caterpillar-SSA-Methode(Singular Spectrum Analysis) basiert.
Eingeschränkte Version des SSACD Forecast Indikators. Zu den Einschränkungen gehören der Parametersatz und sein Bereich.
Spezifität der Methode
Die Caterpillar-SSA ist eine wirksame Methode zur Behandlung nichtstationärer Zeitreihen mit unbekannter interner Struktur. Die Methode ermöglicht es, die zuvor unbekannten Periodizitäten der Reihe zu finden und Prognosen auf der Grundlage der gefundenen Regelmäßigkeiten zu erstellen, die Trends und Oszillationen unterschiedlicher Größenordnungen umfassen.
Im Gegensatz zum MACD, der gleitende Durchschnitte verwendet, haben die Verarbeitungsergebnisse des SSA keine zeitliche Verzögerung gegenüber der ursprünglichen Reihe. Dementsprechend hat der Indikator keinen so typischen Makel wie eine Verzögerung und spiegelt die Variabilität im Verhalten der Preisreihen mit mehr Präzision und Synchronität wider. Die konstruierte Vorhersage zur Extraktion der "schnellen" und "langsamen" Kursschwankungen berücksichtigt die kumulativ ermittelten Faktoren unterschiedlicher Größenordnungen, die ein "Wellen"-Verhalten der Datenreihe bilden und zur Risikominderung in der Strategie genutzt werden können.
Das typische Verhalten, die Signale und die Interpretation des Indikators sind denen des linearen MACD ähnlich.
Der Zweck der Parameter
- N: Datenfragment - Länge der analysierten Preisreihe.
- FastTrend Hochfrequenzgrenze - Filterparameter zur Extraktion des schnell schwingenden Äquivalents des "Durchschnitts".
- SlowTrend Hochfrequenzgrenze - Filterparameter für die Extraktion des sanft oszillierenden Äquivalents des "Durchschnitts".
- Signal SMA Periode - Glättungsperiode der Differenz zwischen den schnellen und langsamen gleitenden Durchschnitten
- Recalculate period - Intervall für die Neuberechnung des Indikators (с)
- BackwardShift - Rückwärtsverschiebung des analysierten Fragments in der Geschichte. Für die Konstruktion des Modells und die Prognose nach den bekannten Daten.
Erläuterung der eingestellten Parameter
Die Hochfrequenzgrenze begrenzt den Beitrag des hochfrequenten Rauschens zur Gesamtstreuung der Preisreihe. Für den schnell schwingenden Durchschnitt beträgt sie 0,5 - 1,5, für den langsamen 1,5 - 4. Der Wert hängt von der Fragmentlänge ab. Alle Oszillatoren, deren Beitrag kleiner oder gleich diesem Wert ist, werden herausgefiltert.
BacwardShift dient dazu, die Berechnung entlang der Datenreihe zu verschieben, um die Prognose mit den bekannten Kursen zu vergleichen und die Indikatorparameter auszuwählen.
P.S. Die Visualisierung der einzelnen Trends ist mit Hilfe des SSA Trend Predictor Indikators möglich.


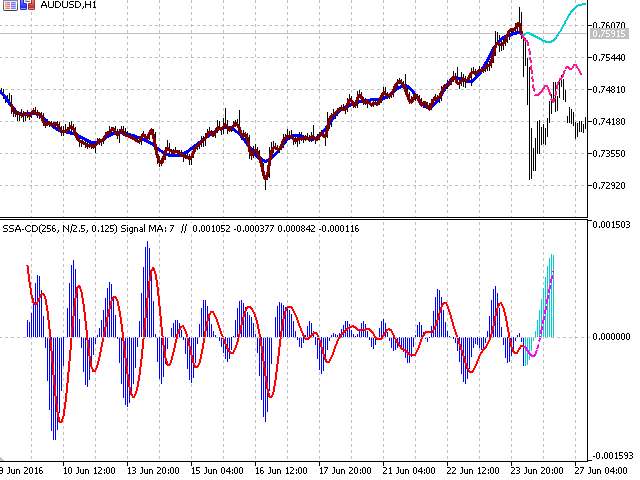


Relativ ungenau.