Hi Low Last Day
- インディケータ
-
Igor Vishnevskii
 My age is 50+, in trade 20+ years. I was lucky that at the beginning of my trading career there were experienced mentors who laid the fundamental concepts of the market in my mind. Almost all of my trading strategy is based on the price (level) of the instrument. As a result of my trading strategy
 - バージョン: 2.3
- アップデート済み: 16 11月 2024
- アクティベーション: 5
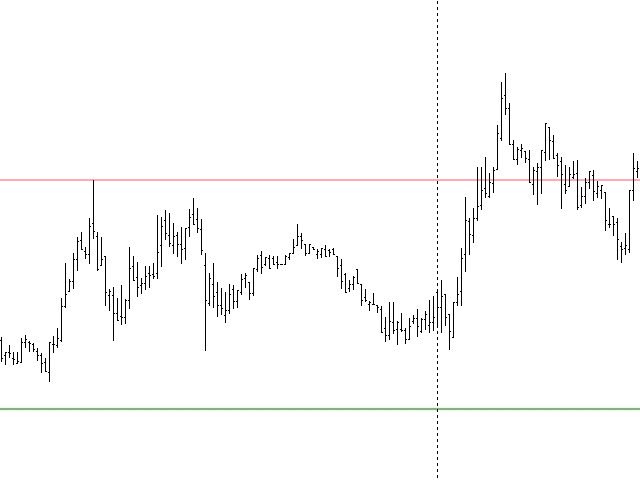
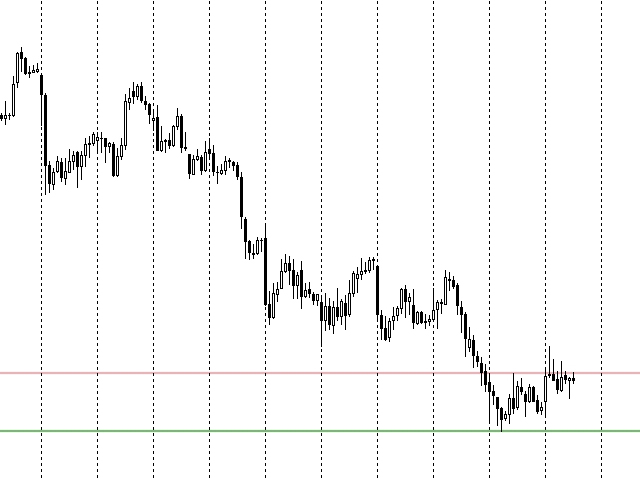
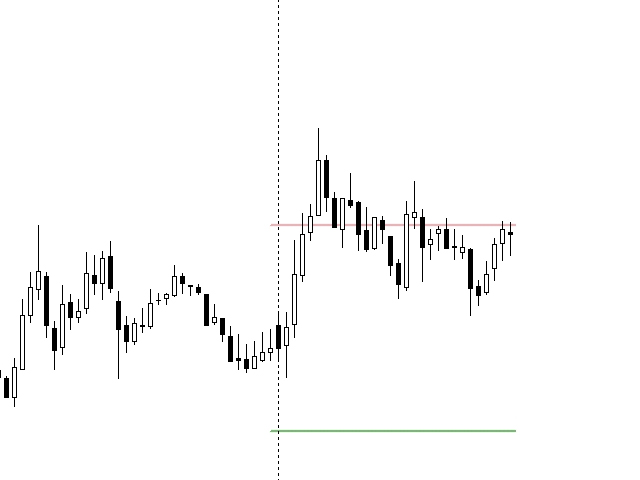
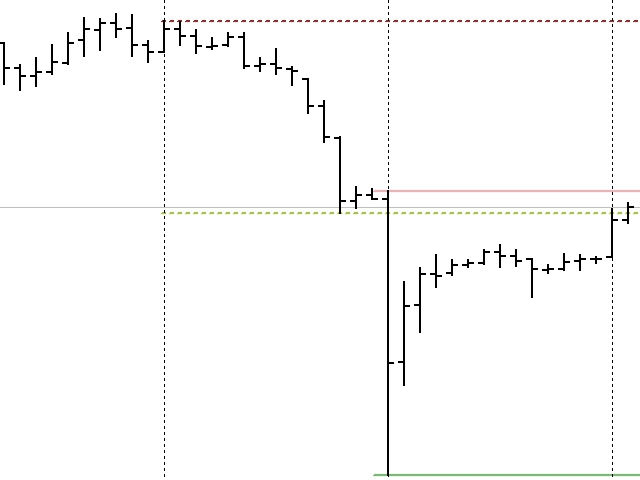
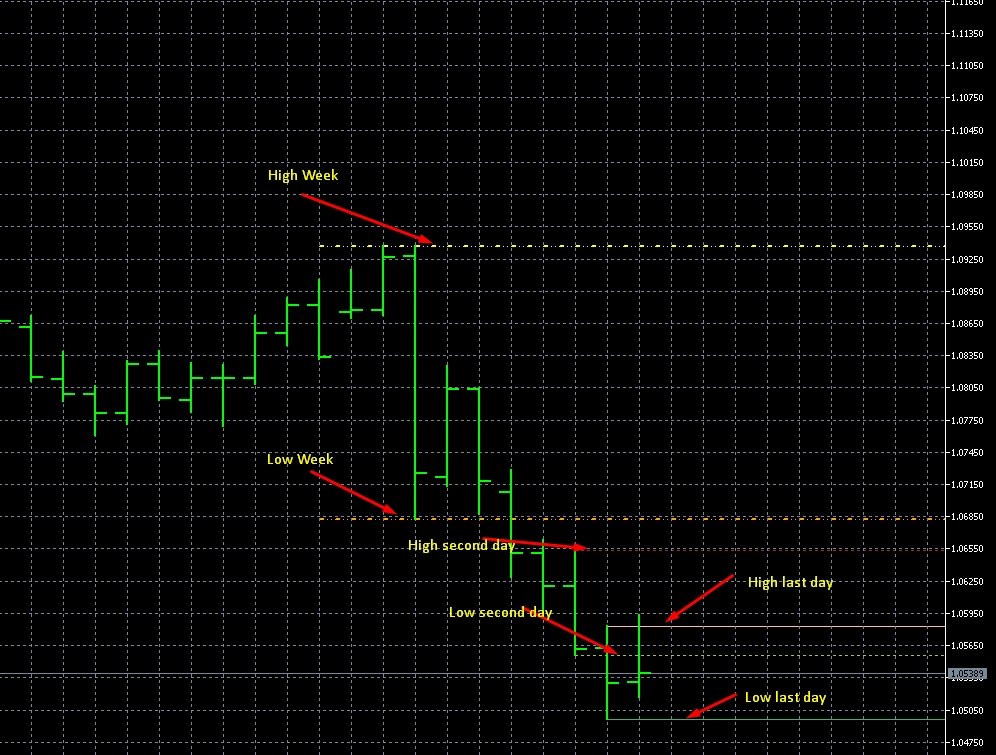
The Hi Low Last Day (Hi Lo Last Day) indicator shows the high and low of the last trading day and the second trading day, as well as the minimum and maximum of last week .
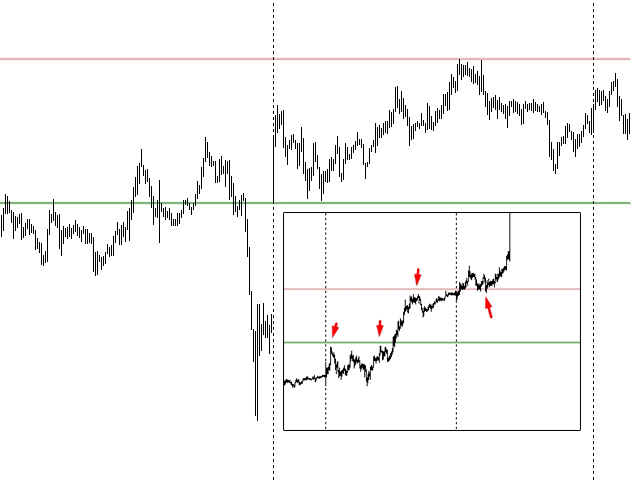
There are many trading strategies on the daily levels. This indicator is indispensable when using such trading strategies.
In fact, everything is simple in trading, you just need to understand and accept it for yourself. There is only price!!! What is price? This is the level on the chart. The level is the price that the buyer and the seller are holding back. What price is capped by the counterparty? A price he won't sell or buy. Therefore, daily levels are very important. To help you understand the situation in the market, use the Hi Low Last Day indicator, which will help determine the mood of the market in the current day.
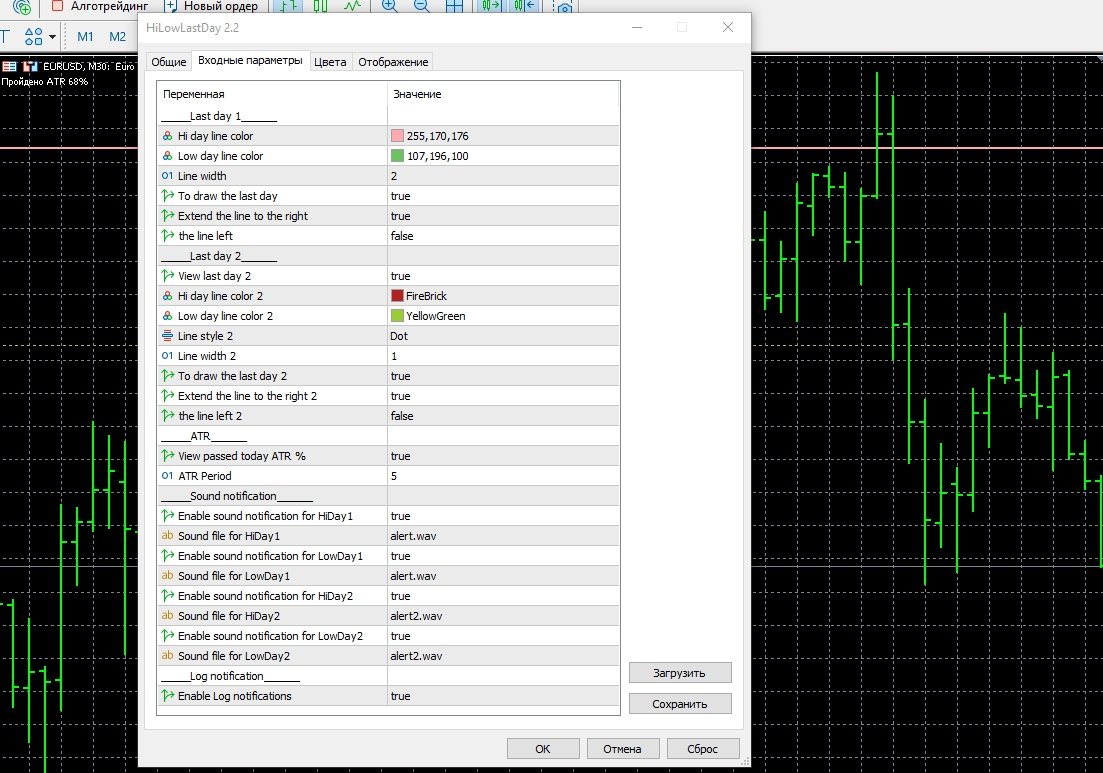
The Hi Low Last Day indicator has flexible settings:
- Line color
- Line width
- Line style
- how to display (the length of the lines)
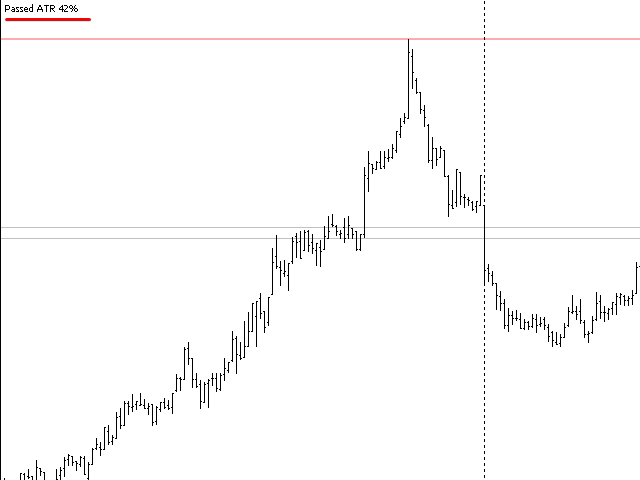
- Passed today ATR
- The ATR period
- To show the second day
- The second day
- Last Week's Setup
The indicator requires very little system resources and does not load the terminal.