Flag Pattern
- Indikatoren
- Version: 1.0
- Aktivierungen: 10

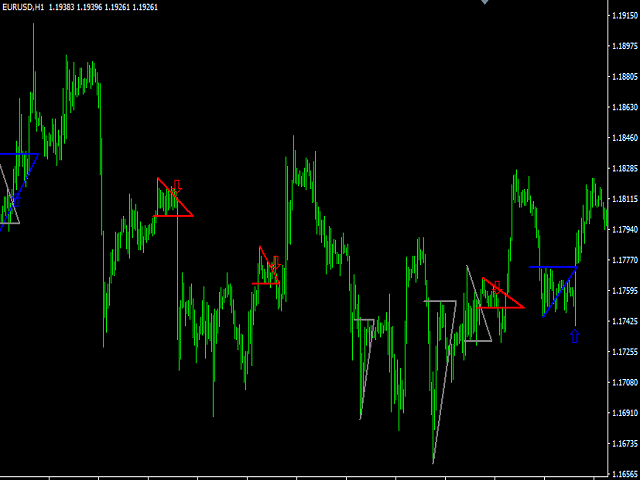
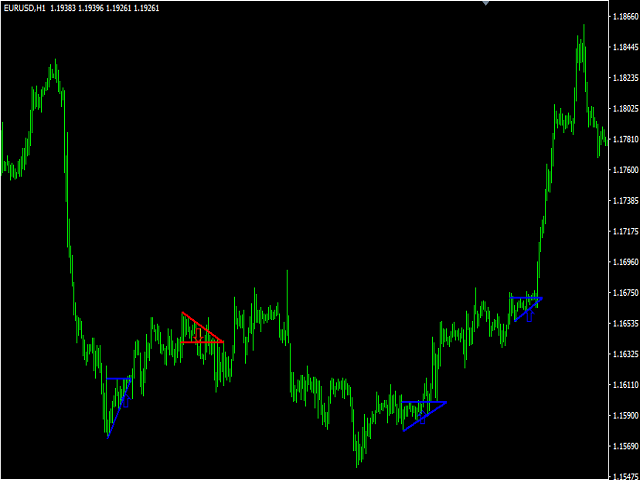
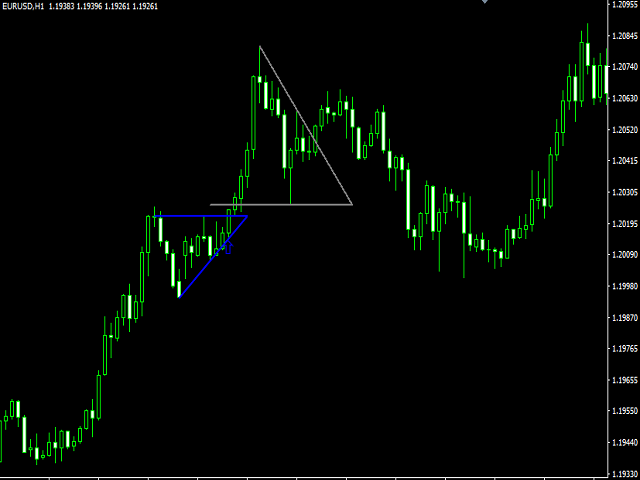
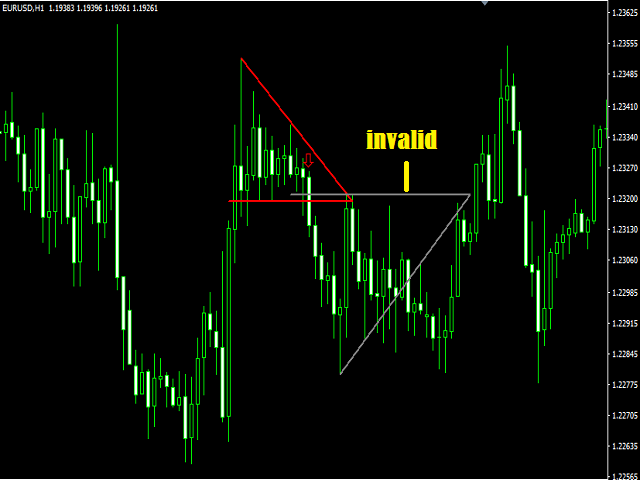
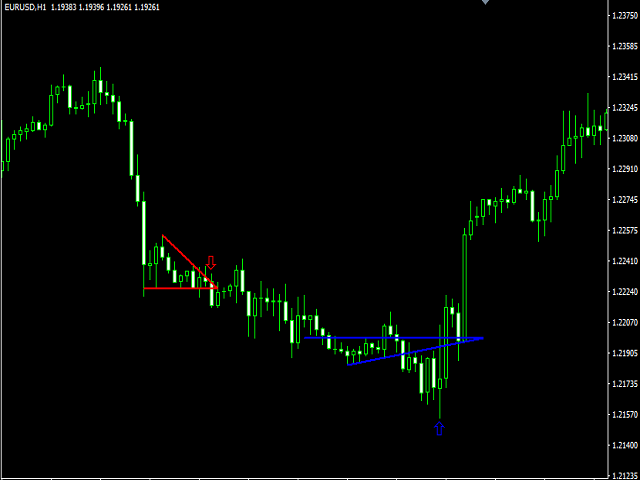
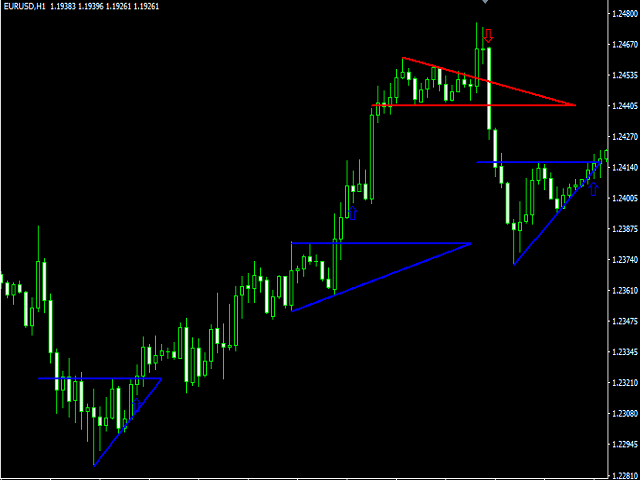
Der Flag Pattern Indikator ist ein Indikator zum Auffinden von Flaggenmustern. Bullish und Bear finden Flaggenmuster. Er findet diese Muster durch seinen eigenen Algorithmus. Die Anzeige ist leicht zu bedienen und einfach.
Eigenschaften
- Bullish und Bear finden Flaggenmuster.
- Zeichnen von Mustern auf dem Grafikbildschirm.
- Ungültige Flaggenmuster.
- Warnung des Benutzers mit der Warnfunktion.
- Flaggenmuster haben die Möglichkeit, die Farben zu ändern.
Parameter
- MinSplashHeight - Min. Höhe des Splashs
- MaxBarsDuration - Maximale Dauer der Balken vor dem Überschreiten
- BullPatternRegColor - Farbe des nicht aktiven Bullenmusters
- BearPatternRegColor - Farbe des nicht aktiven Bärenmusters
- BullPatternWorkColor - Farbe des aktiven Bullenmusters
- BearPatternWorkColor - Farbe des aktiven Bärenmusters
- BuyArrowColor - Farbe des Kaufsignalpfeils
- SellArrowColor - Farbe des Kaufsignalpfeils
- Alerts - Warnung bei gefundenem Muster?
- Push - Benachrichtigung bei gefundenem Muster?
- BarsCount - Die Anzahl der anzuzeigenden Balken