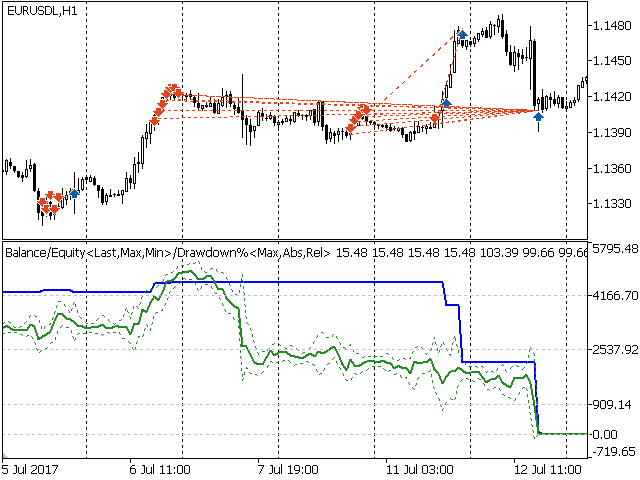
Capital usage chart with balance and euqity curve
- Indikatoren
- Version: 1.0
- Aktivierungen: 5

Alle Händler stehen vor einer ernsten Frage:
Wie kann man die Leistung einer Handelsstrategie einschätzen und das Risiko in Echtzeit kontrollieren?
Auch wenn Backtest und Optimierung in der Strategie-Tester, aber leider müssen Händler mit dem Fluch der Kurvenanpassung zu tun, weil optimierte Ergebnis ist nur für die spezifischen Satz von historischen Daten, die getestet wurde.
Dieser Indikator ruft Handelsinformationen aus historischen Daten ab, zeichnet dann die Bilanz- und Eigenkapitalkurve des Kontos und berechnet den Drawdown in ECHTZEIT.
Er hilft dem Händler bei der visuellen Analyse der Handelsstrategie und bei der Ermittlung ihrer Vorteile und Schwachstellen.
Insbesondere kann er die dynamische Kapitalnutzung überwachen und das Risiko kontrollieren.
Unterstützt beide Margin-Berechnungsmodi: Netting, Hedging.
Unterstützt das Mischen mehrerer Symbole und einzelner Symbole.
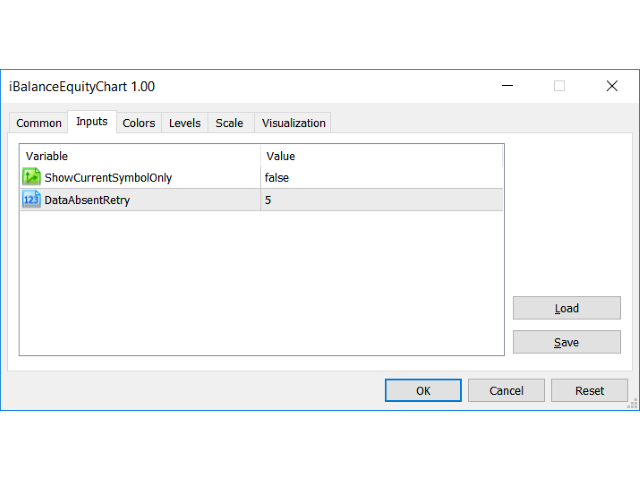
Eingabeparameter-Guides
- ShowCurrentSymbolOnly - Berechnet und zeichnet die Kurve nur für das Chart-Symbol
- DataAbsentRetry - Wenn historische Daten fehlen oder beschädigt sind, versuchen Sie erneut, sie zu laden
Anweisungen zur Bedienung
- Stellen Sie sicher, dass alle historischen Daten aller Symbole vollständig sind, da die Kurve sonst verzerrt wird.
- Öffnen Sie einen beliebigen Symbolchart
- Indikator anwenden
- Da der Spread und der Tick-Wert gleitend sind, weicht der Aktienwert ein wenig vom realen Aktienwert ab.
Chart Beschreibung
- Blaue Kurve - Gleichgewicht
- Grüne Kurve - Die dicke Linie ist der aktuelle Aktienwert, die obere Punktlinie ist der Maximalwert, die untere Punktlinie der Minimalwert
- Max Drawdown% - Maximalwert von absolut und bezogen
- Abs Drawdown% - Absolute DD%: (Saldo(max) - Saldo(aktuell)) / Saldo(max)
- Rel Drawdown% - Bezogene DD%: (Saldo(max) - Eigenkapital(aktuell)) / Saldo(max)
Viel Erfolg!

Excellent idea and may be very useful. Unfortunately, It looks like there are some problems while reading and this is giving wrong readings. Maybe the author may solve this and then the rating will be higher.